UX and research · Intermediate · 18 min
Analyse card sort results with a similarity matrix
By Padding · Updated 18 Nov 2026
Google Sheets or Microsoft Excel for Microsoft 365 · November 2026
You will turn raw open card sort data into a similarity matrix in a plain spreadsheet, read which cards belong together, and finish with a draft site map that has the evidence for every section written beside it.
On this page
An open card sort gives you hundreds of rows that say, in effect, "participant P07 put Parking in a group called Getting here". No single row tells you anything. The pattern only appears when you ask the same question of every pair of cards: out of everyone who did the sort, how many put these two together?
The answer to that question, for every pair, is a similarity matrix. Dedicated card sorting tools draw one for you, often with a tree-shaped chart beside it. Building it yourself in a spreadsheet takes about an hour, costs nothing, and means you understand exactly what the numbers say and what they do not. That matters when a stakeholder asks why "Repeat prescriptions" is not under "Medicines".
This tutorial carries on from Run an open card sort. The running example is the website for Larkfield Clinic, a fictional community clinic: 36 cards (C01 to C36), 15 participants (P01 to P15), recorded in a spreadsheet with a Raw data tab of 540 rows. Use your own sheet in place of theirs; only the cell ranges change.
A word on what the matrix can and cannot do. It tells you which cards people think belong together. It does not tell you what to call the groups, how deep the navigation should be, or whether people can find things once it is built. You will make judgement calls along the way, and the last step is to write each one down so someone else can check it.
Step 1 · Prepare the raw data for comparison
Open the Raw data tab. It has three columns: participant (A), card_id (B) and group_name (C). Add two helper columns.
In D1 type key, and in D2:
=A2&"|"&B2This joins participant and card into one value, such as P07|C14, that the next tab can look up.
In E1 type matrix_group, and in E2:
=IF(OR(C2="Not sure",C2="(not placed)"),"solo-"&B2,C2)Fill both formulas down to the last row. The second column exists because of one quirk of the method: if a participant put four cards into "Not sure", the matrix would count those four as a strong group, when all they share is that the participant could not place them. Giving each unplaced card its own unique value (solo-C14) stops that. If your participants used other names for the same idea ("Don't know", "Other", "Misc"), replace those cells in column E with solo- and the card ID by hand. Keep column C untouched; it is your record of what people actually wrote.
Leave participants you flagged as unusable in the Raw data tab. You choose whether to include them in the next step.
Check it worked
Filter column E for the text solo-. Every row it shows is a card someone could not place, and the count matches the "Not sure" totals you noted when you checked the data. No value in column E reads "Not sure", "Don't know" or any similar catch-all.
Step 2 · Build a grid of group names
Add a tab called "Groups". This puts the data in the shape the matrix needs: one row per card, one column per participant, and in each cell the group that participant put that card in.
- A1
card_id, B1label. In A2 type=Cards!A2and in B2=Cards!B2, then fill down to row 37 (36 cards). - C1 to Q1: the 15 participant IDs, P01 to P15, one per column. Leave out any flagged participant you decided to exclude, and write that decision in your Notes tab.
- In C2:
=INDEX('Raw data'!$E:$E,MATCH(C$1&"|"&$A2,'Raw data'!$D:$D,0))Copy C2 across to Q2, then copy row 2 down to row 37. Every cell now shows a group name such as "Getting here" or a solo- value.
Group names only need to match within one participant's column. P03's "Medicines" and P09's "Medicines" are never compared with each other, so you do not need to tidy names across participants.
Under the grid, in row 39, count how many groups each participant made. In C39:
=COUNTA(UNIQUE(C2:C37))Copy it across to Q39. This includes the solo- cards, so read it as an upper limit. A participant who made 3 groups and one who made 14 had very different ideas of how broad a group should be. Neither is wrong, but a sort with only 2 or 3 groups pushes every similarity score up, so note any extreme ones.
Check it worked
In an empty cell, enter =SUMPRODUCT(--ISERROR(C2:Q37)). It shows 0. If it does not, an ID in row 1 or column A does not match the Raw data tab exactly; look for a trailing space or a P1 written instead of P01. Spot-check one cell against the Raw data tab by filtering for that participant and card.
Step 3 · Calculate the similarity matrix
Add a tab called "Matrix". Column A lists card IDs, column B their labels, and the card IDs also run across row 1, so every pair of cards has a cell.
- A1
card_id, B1label. A2 to A37: the card IDs, C01 to C36 (copy them from the Groups tab and paste as values). - In B2,
=INDEX(Cards!$B:$B,MATCH(A2,Cards!$A:$A,0)), filled down to row 37. - In C1,
=TRANSPOSE(A2:A37). The IDs spill across C1 to AL1.
Now the formula that does the work. In C2:
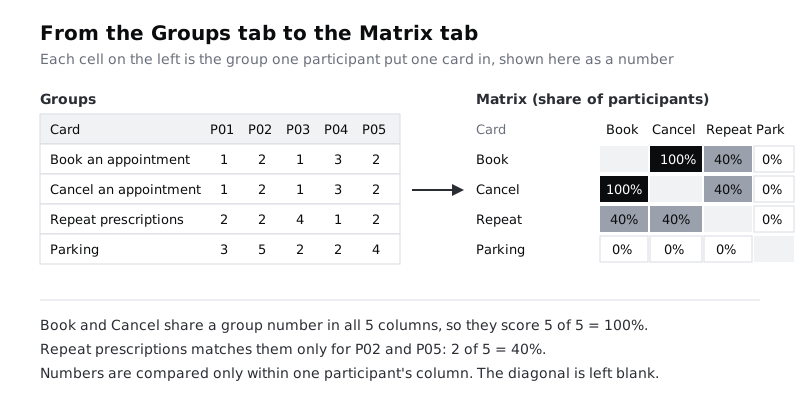
=IF($A2=C$1,"",SUMPRODUCT(--(INDEX(Groups!$C$2:$Q$37,MATCH($A2,Groups!$A$2:$A$37,0),0)=INDEX(Groups!$C$2:$Q$37,MATCH(C$1,Groups!$A$2:$A$37,0),0)))/COLUMNS(Groups!$C$1:$Q$1))Read it from the inside out. The first INDEX(...,0) fetches the row card's whole row from the Groups tab: the 15 group names it was given. The second fetches the column card's row. The = compares them position by position, which means participant by participant, and gives TRUE where both cards were in the same group. -- turns TRUE and FALSE into 1 and 0, and SUMPRODUCT adds them up. Dividing by the number of participant columns turns the count into a share. The IF leaves the diagonal blank, because a card is always with itself and a row of 100% cells would get in the way later.
Copy C2, select C2:AL37 and paste. Format the range as percentages with no decimal places.
Check it worked
The matrix is symmetrical: the cell for C05 against C12 equals the cell for C12 against C05. Pick any pair, count by eye in the Groups tab how many participant columns show the same group name for both cards, divide by 15, and the matrix shows the same figure. The diagonal is blank and no cell is above 100%.
Step 4 · Shade the matrix and list each card's best partner
A 36 by 36 grid of percentages is 1,260 numbers. Shading makes it readable.
Select C2:AL37. In Google Sheets, open Format > Conditional formatting and choose the colour scale option; in Excel, use Home > Conditional Formatting > Color Scales. Set the minimum to white or very light grey and the maximum to a dark colour. One colour going from light to dark reads better than a red-to-green scale, and works for colleagues with colour vision deficiency.
Then add two columns to the right, leaving AM blank as a gap:
- AN1
best_partner, AO1score. - In AO2:
=MAX(C2:AL2). - In AN2:
=INDEX($B$2:$B$37,MATCH(INDEX($C$1:$AL$1,MATCH(AO2,C2:AL2,0)),$A$2:$A$37,0))
Fill both down to row 37. Each card now shows the card it was most often grouped with, and how often. If two partners tie, the formula shows the first; look along the row to see the other.
Now read the score column. As a rough guide for a study of around 15 people:
- 70% or more: a strong pairing. Most participants agree these belong together.
- 40% to 69%: a real but contested pairing. Some people saw a link, others put the cards apart.
- Under 40%: the card has no clear home. These are your weakest cards, and often your most useful findings.
These cut-offs are a starting point, not a rule. If almost every card scores over 70%, participants made few broad groups; if almost none do, they made many narrow ones. Adjust the bands to your data and write down the ones you used.
Check it worked
The matrix shows dark patches and pale areas rather than an even wash. Copy columns A, B, AN and AO to a new tab called "Partners", paste them as values (so sorting does not disturb the formulas), and sort by score, highest first. You can name your five strongest pairs and every card that scored under 40%.
Step 5 · Form groups from the strongest pairs
Add a tab called "Clusters" with columns group, card_id, label and reason. You are going to build groups by hand, in the same order a clustering algorithm would: strongest links first.
- Take the strongest pair from the Partners tab that is not yet in a group. Write both cards under a new group, A.
- Go to the Matrix rows for those two cards. Any other card that scores in the strong band with both of them joins group A. In the
reasoncolumn, write the scores, for example "78% with C03, 72% with C04". - Keep adding: a card joins the group when it scores at or above your strong band with most of the cards already in it, not just one. That rule stops a group growing by a chain, where A links to B, B to C, and C has nothing in common with A.
- When no more cards qualify, start group B from the strongest remaining pair, and repeat.
- Stop when the remaining cards have no strong pairs. List them under a group called "Unplaced" for now.
Some cards will qualify for two groups. Put each card in the group where its average score is higher, and write "also 61% with group C" in the reason column. These cards are candidates for a cross-link later.
At Larkfield this produced three clear groups (appointments and results, vaccinations, and visiting the clinic), two smaller ones (registering and changing details, and long-term conditions), and four unplaced cards.
Check it worked
Every card ID appears exactly once in the Clusters tab; =COUNTA(UNIQUE(B2:B37)) in that tab returns your card count. Every card in a lettered group has a reason with at least two scores, and you can explain any group to a colleague by pointing at those scores.
Step 6 · Reorder the matrix to test the groups
The groups are only as good as your reading of the scores. Reordering the matrix lets you see them.
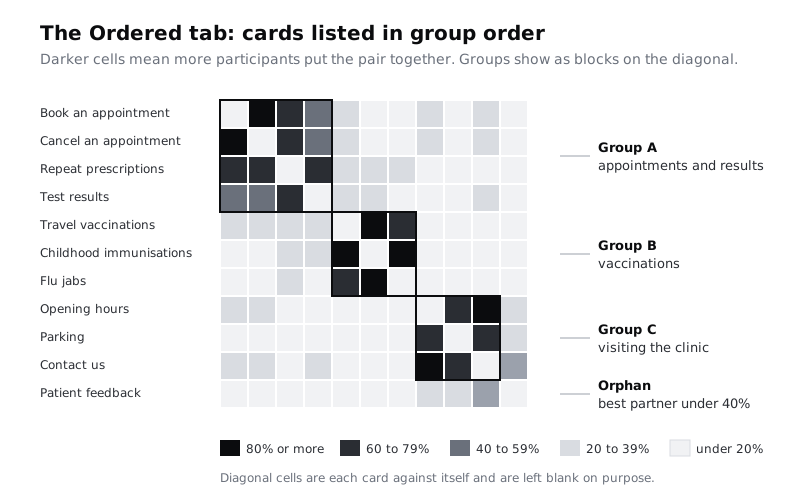
Right-click the Matrix tab and duplicate it. Name the copy "Ordered". Copy the card_id column from the Clusters tab, in group order, and paste it as values into Ordered!A2:A37. Because row 1 is TRANSPOSE of column A, and every formula looks cards up by ID, the whole matrix rearranges itself into group order.
Good groups now show as dark squares sitting on the diagonal. Look for three things:
- A square with a pale hole in it: one card in the group is weakly linked to the rest. Check its reason and consider moving it.
- Dark cells outside any square: two groups have a lot in common. They might be one section, or a section and a subsection.
- A row that stays pale all the way across: a card with no home, which you already listed as unplaced.
For each group, work out its cohesion. If group A occupies rows 2 to 7 and columns C to H, then =AVERAGE(C2:H7) gives the average similarity inside it. AVERAGE ignores the blank diagonal. Write the figure next to the group in the Clusters tab.
Check it worked
The Ordered tab shows one dark square per lettered group, and the squares cover the diagonal from top left to bottom right, apart from the unplaced cards at the end. Each group in the Clusters tab has a cohesion figure. Any group with a cohesion under about 50% is marked for a second look.
Step 7 · Name each group from the participants' words
The matrix knows nothing about names. For those, go back to what people wrote.
For each group, find the participants' own groups that held most of its cards. In the Groups tab, filter column A for the group's card IDs and read down each participant column: the name that appears most often in a column is that participant's name for this cluster. Collect the names into the Clusters tab, with a count of how many participants used each one or a close variant, such as "Appointments" (6), "Booking" (4), "My care" (3).
When choosing a name:
- Prefer a name several participants used, or the word they shared. Their vocabulary is the point of an open sort.
- Avoid the clinic's internal terms, even if they are accurate. If nobody wrote "Primary care services", it should not be a menu label.
- Watch for names that describe a feeling rather than content ("Important stuff", "Things I'd check first"). They tell you about priority, not structure.
- If the names split two ways, write both down. That disagreement is a question for the tree test, not something to settle now.
Check it worked
Each lettered group in the Clusters tab has a proposed name and, beside it, the participant names it came from with counts. You can point to at least two participants who used the chosen word or something very close. No proposed name is a term only staff use.
Step 8 · Draft the site map and the evidence
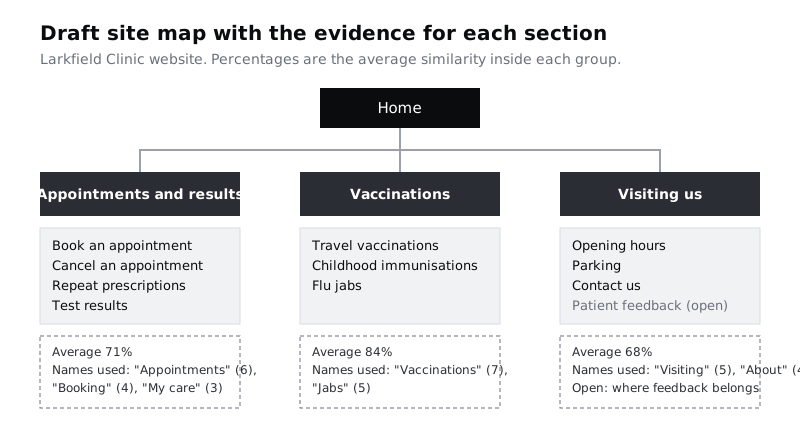
Turn the Clusters tab into a structure. On a new tab called "Site map", or in a document, write it as an indented list:
- Top-level sections from your strongest, broadest groups.
- Cards inside each, as the pages that section holds.
- Smaller groups that sat close to a larger one in the Ordered tab (dark cells just outside a square) as subsections of it, rather than new top-level sections.
- Cross-links for cards that scored well with two groups, noted as "also linked from".
Then decide what happens to each unplaced card, and write the decision and the reason: move it to its best partner's section, rewrite its label and test again, link it from two places, or keep it as an open question.
Beside every section, write the evidence: the cohesion figure, the participant names it is based on, and anything you are unsure about. This is what makes the site map reviewable. Without it, the structure is your opinion with a spreadsheet attached.
Check it worked
Every card from the sort appears in the site map exactly once as a page, with any extra placements marked as links. Every section has a cohesion figure and at least one participant name behind it. Your list of open questions has at least one entry; if it has none, look again at the cards that scored under 40%.
Next steps
The draft site map is a hypothesis built from how people group content. It has not yet been tested on whether people can find things in it. Do that next with Run a tree test on your navigation, and turn your open questions into its tasks. If several cards ended up unplaced because of their labels, rewrite them using the guidance in Run an open card sort and run a short second sort on just those cards.
Part of these paths
Related tutorials
- Run an open card sortYou will have a deck of 30 to 40 neutral content cards, sorts from around 15 participants, and every group and group name they made recorded in one sheet, ready to analyse.
- Run a tree test on your navigationYou will have a proposed navigation tested with real people as a text-only tree, scored for success, directness and first click on every task, and a list of the labels to change before anyone designs a screen.
Need this done for you?
Padding does this work for growing companies, from the first diagnosis to a system that keeps working.
Get new tutorials