UX and research · Beginner · 14 min
Map a current-state customer journey
By Padding · Updated 18 Nov 2026
A spreadsheet (or a whiteboard and sticky notes) and your research notes · November 2026
You will have a journey map of how patients book, attend and follow up on a clinic appointment today, with every pain point tied to the research that shows it and every guess marked as a guess.
On this page
A journey map drawn in a kick-off workshop usually shows the journey the team believes in. It has tidy stages, a dip in the middle, and pain points that happen to match the features someone already wants to build. It feels useful, and it is mostly opinion.
A current-state map is different in one way that matters: it describes what people do today, and each claim on it points back to something a real person said or did. Where the research is silent, the map says so. That makes it slower to fill in, and far harder to argue with.
This tutorial uses Larkfield Clinic, a fictional community clinic planning an appointment booking app. Before anyone sketches the Home or Pick a time screens, the team wants to know how booking works now, from the moment a patient decides they need an appointment to the reminder and follow-up afterwards. You have notes from six patient interviews, a morning spent observing the reception desk, and a week of the clinic's phone log. You will turn them into a map with five rows (stages, actions, channels, thoughts and feelings, pain points), an evidence reference on every pain point, and a clear mark on everything that is still a guess.
The map shows today only. Ideas for the app go in a separate parking list, not on the map.
Step 1 · Fix the scope before you open a file
A journey map without edges grows until it covers everything the clinic does. Write four lines at the top of a new spreadsheet tab, or on a card at the corner of the whiteboard:
- Who: the person whose journey this is. For Larkfield: an adult patient booking a routine appointment for themselves. Parents booking for children and staff rebooking patients are different journeys; note them for later maps.
- Starts when: the first trigger you can see in the research. Here: the patient notices they need an appointment (a repeat prescription running out, a symptom, a letter asking them to come in).
- Ends when: the last moment that still belongs to this journey. Here: the patient has had the appointment and knows what happens next (results, a follow-up, nothing).
- Today, as of: the date range of your research, for example "Interviews and observation, October to November 2026". A current-state map goes out of date, and this line tells a later reader by how much.
If the research covers more than one kind of person behaving in clearly different ways, pick one for this map. A map that averages a first-time patient and a regular who rings the same receptionist every month describes neither of them.
Check it worked
Your file or board has four labelled lines: Who, Starts when, Ends when, Today as of. Read the Who line aloud and ask whether every interview you plan to use is about that person. Any that are not are set aside, and you can say why.
Step 2 · Give every piece of research an ID
Evidence is only useful if a reader can find it. Make a second tab called Sources and give every source a short ID before you write anything on the map:
- P1 to P6: patient interviews; six adult patients of mixed ages; October 2026.
- OBS: reception observation, three hours; Funmi (receptionist), 41 calls; 4 November 2026.
- LOG: phone log export; all inbound calls for one week; 3 to 9 November 2026.
- EM: patient emails to the general inbox; 28 emails; October 2026.
In a spreadsheet, make these four columns: ID, Source, Who, Date.
Then go through your notes and give each usable observation its own reference, such as P3-07 for the seventh note from the third interview, or OBS-12 for the twelfth entry in the observation notes. If your notes already have line numbers or timestamps, use those instead.
Do not paraphrase yet. Keep the words as they were said or written, so that a quote on the map can be checked against the source.
Check it worked
The Sources tab lists every source with an ID, a description, who it involved and when. Pick three notes at random: each has a reference you could quote, and you can open the original and find it in under a minute.
Step 3 · Lay out the stages from what people did
Stages are the columns of the map. Take them from the research, not from the clinic's process diagram. Read through the notes and write down, in order, each distinct thing patients were trying to get done. Group these into four to seven stages, named from the patient's point of view.
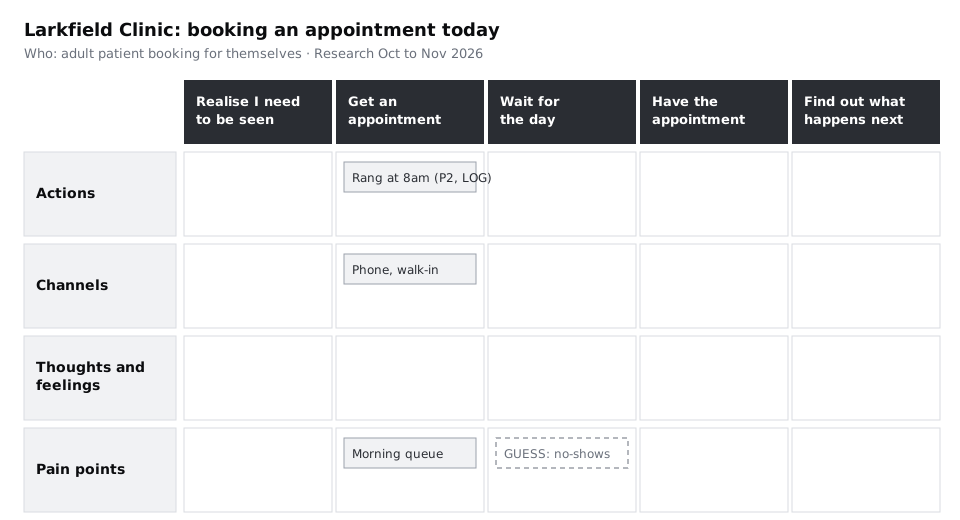
For Larkfield, the notes support five stages:
- Realise I need to be seen
- Get an appointment
- Wait for the day
- Have the appointment
- Find out what happens next
Notice what is missing: there is no stage called "Choose a service" even though the planned app has a screen with that name. Patients in the interviews never chose a service; they described a problem and the receptionist decided. That is a finding, and it belongs on the map as an action under "Get an appointment", not as a stage borrowed from the design.
Put the stages across the top of the spreadsheet, one per column, with the row labels down the first column: Actions, Channels, Thoughts and feelings, Pain points.
Check it worked
Your map has four to seven stage columns, each named as something the patient is trying to do, in the patient's words. For each stage, you can point to at least two sources that describe it. If a stage has only one, or none, merge it into a neighbour or mark the whole column as a guess (see the step on marking guesses).
Step 4 · Fill in actions and channels
Work one stage at a time. In the Actions row, list what patients actually did, as short verb phrases, each with its source reference:
- Get an appointment: "Rang at 8am, line busy, rang again" (P2-04, P5-02, LOG); "Walked in to ask at the desk" (P4-06, OBS-09); "Described symptoms, receptionist picked the clinician" (OBS-03, OBS-15, P1-08); "Asked for a later slot to fit around work" (P3-05).
In the Channels row, list the touchpoints used in that stage: phone, walk-in, text message, letter, the clinic website, a family member. Channels are where the app will compete with what already works, so be exact. The Larkfield phone log shows 61 per cent of calls in the week arrived between 8am and 9:30am; write that number with its source (LOG) rather than "most calls come early".
Include the actions that look clumsy. A patient who books by asking their daughter to ring on her lunch break is doing the journey; leaving it out because it is not "the proper process" removes the part the app most needs to understand.
Check it worked
Every cell in the Actions and Channels rows has at least one entry, and every entry ends with a source reference in brackets. Any cell you could not fill is left visibly empty or marked "no data", not filled from memory.
Step 5 · Add thoughts and feelings in people's own words
The Thoughts and feelings row is where maps most often slide into invention. Fill it only with quotes or close paraphrases from the research, each referenced:
- Get an appointment: "By the time I get through, all the morning ones have gone." (P2-05); "I never know if it's worth bothering them." (P6-03)
- Wait for the day: "I put it in my phone straight away or I'll forget." (P3-09)
- Find out what happens next: "Nobody told me whether they'd ring with the results or I should ring them." (P1-12, P4-11)
If you want to draw the familiar up-and-down emotion line, base each point on these quotes and keep it rough: high, neutral, low. Do not plot it from a score you did not collect. Two or three words per stage, such as "anxious, rushed", are enough and are easier to defend than a curve.
Check it worked
Each entry in the Thoughts and feelings row is in quotation marks or clearly marked as a paraphrase, and has a reference. Read the row aloud: it should sound like several different people, not like one designer imagining a patient.
Step 6 · Write pain points with their evidence
A pain point is a moment where the journey costs the patient time, money, effort, worry or a missed appointment. Write each one as a plain statement of what goes wrong, followed by how many sources show it and which ones:
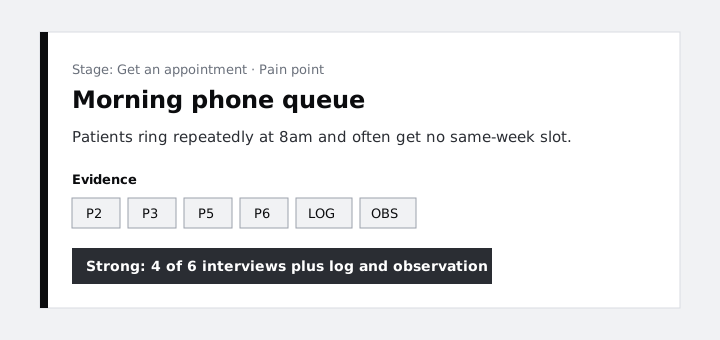
- Morning phone queue. Patients ring repeatedly at 8am and often get no same-week slot. Seen in 4 of 6 interviews (P2, P3, P5, P6), the phone log (61 per cent of calls before 9:30am) and observation (OBS-01 to OBS-06).
- No clear next step after the visit. Patients do not know whether to wait for a call or ring for results. 3 of 6 interviews (P1, P4, P6) and 7 of 28 emails (EM).
- Forgotten appointments. Patients rely on their own phone calendar; the clinic sends no reminder. 2 of 6 interviews (P3, P5).
The count matters. "4 of 6 interviews plus the phone log" and "2 of 6 interviews" are both real, but they are not equally strong, and the next person to use the map needs to see the difference. Do not rank or solve the pain points yet; that is a separate job.
Check it worked
Every pain point on your map has three parts: a one-sentence description, a count ("x of y interviews", "n of m emails") and the source IDs. Open one ID per pain point in the Sources tab and confirm the note says what the pain point claims.
Step 7 · Mark what is evidence and what is a guess
By now there will be gaps. Nobody in the six interviews talked about cancelling an appointment, yet the team is sure cancellations are a problem. The receptionist mentioned that some patients "never turn up", but no patient described not turning up.
Do not delete these, and do not slip them in as if they were findings. Add them to the map in a different style (grey text, a dashed outline on a sticky note, or a "GUESS" prefix in the spreadsheet) with a note of where the belief came from:
- GUESS: Patients who miss appointments forgot about them. Source: staff opinion (OBS-22); no patient evidence.
- GUESS: Patients would book online if they could. Source: team assumption; one patient (P4-09) said the opposite.
Then add a short legend at the top of the map: solid entries are from research and carry a reference; marked entries are guesses with no or weak evidence. Copy each guess to the bottom of the Sources tab under a heading "Questions for the next round", so it turns into a research question rather than a quiet assumption.
Check it worked
Your map has a legend that explains how guesses are marked, at least one entry in the guess style (almost every first map has some), and a "Questions for the next round" list with the same number of items as there are guesses on the map. No entry anywhere on the map is unmarked and unreferenced.
Step 8 · Walk the map with someone who was there
Before you share the map widely, take thirty minutes with one person who saw the journey first-hand: the receptionist you observed, a clinician, or a colleague who ran some of the interviews. Go stage by stage and ask three questions at each:
- Is anything here wrong, or in the wrong order?
- Is anything you see every week missing?
- Is anything here rarer than the map makes it look?
Record their answers as a new source (for example REV-01) rather than editing the map silently. If Funmi says patients often ring back to ask whether their blood test results are in, that strengthens the "No clear next step" pain point; add REV-01 to its sources. If she says something the research never showed, add it as a guess and a question, not as a finding: one person's view is a lead, not evidence of a pattern.
Finally, write the date and "Reviewed with: Funmi, reception" under the scope lines.
Check it worked
The map shows a review date and the reviewer's role, the Sources tab has a REV entry, and any change since the review carries that reference. Compare the version before and after: you can say in one sentence what the review changed.
Next steps
You have a map of today's journey that a sceptical reader can check line by line. The next job is to decide which of its pain points are worth designing for.
- Turn the pain points into ranked opportunities in Prioritise opportunities from a journey map.
- Use the same research to describe the person on this map in Build a persona from research data.
- Fill the gaps you marked as guesses with Run your first user interview or Observe people at work with a contextual inquiry.
Part of these paths
Related tutorials
- Build a persona from research dataYou will have two personas for Larkfield Clinic patients, each built from a group of interview participants who behave alike, with a source note against every line and no invented detail.
- Prioritise opportunities from a journey mapYou will turn the pain points on a journey map into opportunity statements, score each one for frequency, severity and effort, and end with a ranked list of three opportunities to design for and a written reason for each.
Need this done for you?
Padding does this work for growing companies, from the first diagnosis to a system that keeps working.
Get new tutorials