UX and research · Intermediate · 14 min
Prioritise opportunities from a journey map
By Padding · Updated 18 Nov 2026
Your journey map, a spreadsheet and one hour with someone who builds the product · November 2026
You will turn the pain points on a journey map into opportunity statements, score each one for frequency, severity and effort, and end with a ranked list of three opportunities to design for and a written reason for each.
On this page
Most journey maps end up on a wall or in a shared drive, admired once and never used again. The map did its job of showing what is wrong, but nobody turned "what is wrong" into "what we will work on". That second move needs a different kind of thinking: comparing pain points against each other, admitting some of them will not be fixed this year, and writing down why.
This tutorial is that second move. You pull each pain point off the map into a spreadsheet, rewrite it as an opportunity (a need the product could meet, not a feature), and score it on three things: how often it happens, how much it hurts, and how hard it is to fix. The scores do not make the decision for you. They make the trade-offs visible, so the decision you make can be explained and challenged.
The running example is Larkfield Clinic, a fictional community clinic planning an appointment booking app (Home, Choose a service, Pick a time, Your details, Confirm, Booked). The team has a current-state map built from six patient interviews (P1 to P6), a morning observing reception (OBS), a week of the phone log (LOG) and 28 patient emails (EM). If you made your own map in Map a current-state customer journey, use that instead.
Step 1 · Pull every pain point into one table
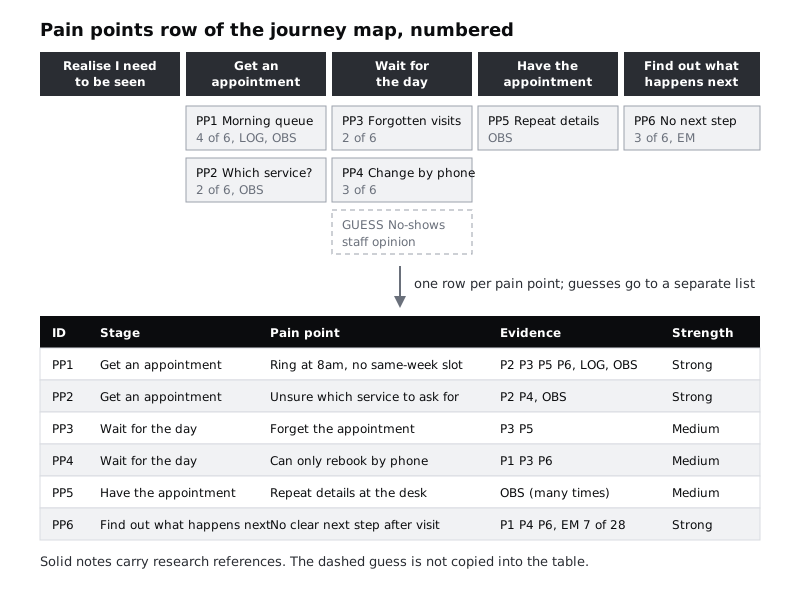
Open a new spreadsheet tab called Opportunities. Give it these columns: ID, Stage, Pain point, Evidence, Strength. Go along the pain point row of your map from left to right and copy each one into its own row. Number them PP1, PP2 and so on, so they never get confused with participant IDs.
For Larkfield, six pain points come across:
- PP1 (Get an appointment): patients ring at 8am and often get no same-week slot. P2, P3, P5, P6, LOG, OBS.
- PP2 (Get an appointment): patients are unsure which kind of appointment to ask for. P2, P4, OBS.
- PP3 (Wait for the day): patients forget the appointment. P3, P5.
- PP4 (Wait for the day): the only way to change a booking is to join the morning phone queue. P1, P3, P6.
- PP5 (Have the appointment): patients repeat their details at the desk. OBS.
- PP6 (Find out what happens next): patients do not know whether to wait for a call or ring for results. P1, P4, P6, and 7 of 28 emails (EM).
Fill the Strength column with Strong (two or more interviews plus a second kind of source), Medium (two or more interviews on their own, or one non-interview source that shows it repeatedly) or Weak (a single mention). By that rule Larkfield's PP1, PP2 and PP6 are Strong, and PP3, PP4 and PP5 are Medium. Leave anything the map marks as a guess, such as "no-shows happen because people forget", out of this table. Guesses go to the research questions list, not into a ranking, because ranking a guess makes it look like a finding.
Check it worked
The number of rows in your table equals the number of referenced pain points on the map, every row has at least one source ID in the Evidence column, and no row starts with GUESS. Count the guesses you left out and confirm each one appears in your research questions list.
Step 2 · Merge pain points that share a cause
Two pain points can look different on the map and come from the same place. Read the table looking for rows where fixing one would fix the other. Ask of each pair: "If this one disappeared tomorrow, would the other still happen?"
At Larkfield, PP4 (changing a booking means the phone queue) shares a channel with PP1, but the answer to the question is yes, it would still happen: a patient with a booking still has no other way to move it. Keep them separate. If the team had also written "patients ring repeatedly because lines are engaged" as its own pain point, that would merge into PP1, because it is the same queue seen from another angle.
When you merge, keep the clearest wording, combine the source IDs, and add a note in a new Merged from column so the trail back to the map is not lost.
Check it worked
For every pair of rows that sit in the same stage, you can say in one sentence why they stay separate or show the merged row with both original IDs in Merged from. No source ID was lost: the total set of IDs across the table is the same as before you merged.
Step 3 · Rewrite each pain point as an opportunity
A pain point describes what goes wrong. An opportunity describes what the person needs to be able to do instead. Add a column called Opportunity and write one for each row, using this shape:
[Who] needs a way to [do or know something] at [stage], because [what happens today, from the evidence].
For Larkfield:
- O1: Patients need a way to get a same-week appointment without waiting in the 8am phone queue, because most callers in the log ring before 9:30am and many get nothing that week.
- O2: Patients need a way to know which kind of appointment to ask for when they book, because reception spends time redirecting them and some book the wrong one.
- O3: Patients need a way to remember an upcoming appointment while they wait for the day, because the clinic sends nothing and some forget.
- O4: Patients need a way to change a booking without the phone queue, because today the only route is the same 8am rush.
- O5: Patients need a way to give their details once, because they repeat them at the desk on arrival.
- O6: Patients need a way to know what happens after their visit, because they are unsure whether to wait or ring, and some email to ask.
Two traps to check for. First, a solution in disguise: "Patients need an app with SMS reminders" has already chosen the answer. Strip it back to the need ("remember an upcoming appointment") so the design work still has room. Second, an opportunity with no person in it: "Improve the follow-up process" says nothing about whose problem it is.
Check it worked
Every row has an opportunity that names a person, a stage and a reason, and none of them contains a product word such as app, screen, button, SMS, chatbot or notification. Read each one aloud next to its pain point: a colleague who has not seen the map should be able to tell which pain point it came from.
Step 4 · Score frequency and severity from the evidence
Add two columns, Frequency and Severity, each scored 1 to 3. Write the scales at the top of the tab before you score anything, so the numbers mean the same thing on every row:
Frequency: how often does this happen?
- 1: one source mentions it, and nothing suggests it is common.
- 2: a third to a half of participants with no second source, or seen repeatedly in one kind of data only.
- 3: most participants, or at least half of participants plus a second kind of source (a log, observation or support data) that shows the same thing.
Severity: how much does it cost the person when it happens?
- 1: an annoyance with an easy workaround.
- 2: lost time, repeated effort or real worry, but the person still gets the care.
- 3: the person misses care, loses the appointment, or gives up.
Score frequency from the Evidence column, not from memory. Score severity from what participants said and did, not from how bad it sounds to the team. At Larkfield, PP1 is a 3 for frequency (four of six interviews plus the log) and a 3 for severity (P5 described giving up and going to a walk-in centre). PP6 is also a 3 for frequency, but only through the second clause: three of six interviews is exactly half, and 7 of the 28 emails ask what happens next. PP4, with the same three of six but no second source, stays a 2. PP5 is a 2 for frequency (the desk observation showed it many times in one morning) but a 1 for severity: irritating, and nobody missed care because of it.
Add a Value column that multiplies the two (in most spreadsheets, =F2*G2 if Frequency is column F and Severity is column G). Value runs from 1 to 9.
Check it worked
Your scales sit above the table in writing, every row has both scores and a Value between 1 and 9, and for each score of 3 you can point to the source ID that justifies it. If you cannot, lower the score to 2 or mark the row for more research.
Step 5 · Score effort with someone who builds the product
Effort is the score designers most often guess and most often get wrong. Book 30 minutes with an engineer, a product owner or whoever knows what is hard to change. Do not show them your Value column yet; you want their effort judgement on its own, not bent by which opportunities you already like.
Use a three-point scale and read it out at the start:
- 1 Small: content, wording, or a change inside one existing screen or process.
- 2 Medium: a new screen or feature that uses systems the team already controls.
- 3 Large: a new integration, a change another team or supplier must make, or a change to clinic policy.
Go row by row and ask: "If we tried to meet this need in its simplest useful form, which of these is it?" The phrase "simplest useful form" matters. At Larkfield the engineer scored O1 as 3, because offering same-week slots online means connecting to the clinic's appointment system, which a supplier runs. O3 scored 1: a reminder can be sent from the booking data the app already holds. O6 scored 2: telling patients what happens next needs new content from clinicians, but no new system.
Write their reasons in a short Effort note column. You will need them when someone asks why a high-value item is not at the top.
Check it worked
Every row has an Effort score from the person who builds it, not from you, and every score of 3 has a note naming the outside dependency (a supplier, another team, a policy). If the engineer said "it depends" on a row, the note says what it depends on.
Step 6 · Rank the list and choose three
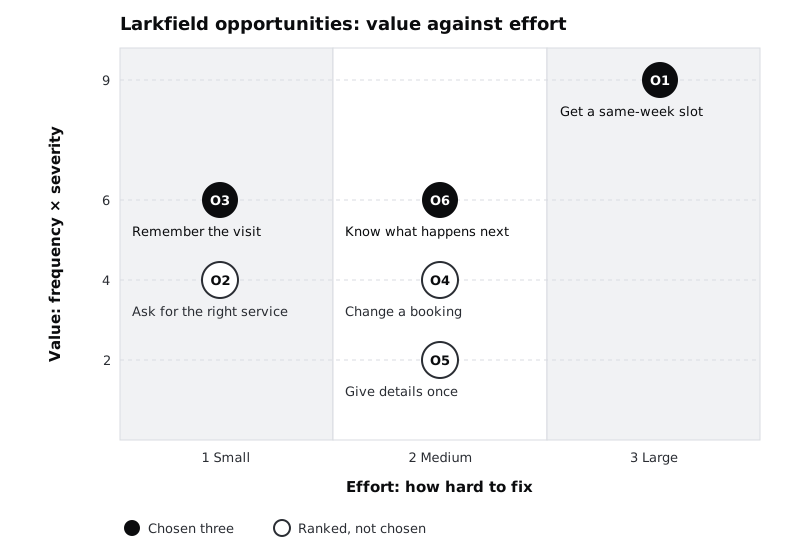
Sort the table by Value, highest first. Where two rows tie, put the one with stronger evidence first, then the one with lower effort. For Larkfield that gives:
- O1 Same-week slot without the queue: frequency 3, severity 3, value 9, effort 3, strong evidence.
- O6 Know what happens next: frequency 3 (half the interviews plus 7 of 28 emails), severity 2, value 6, effort 2, strong evidence.
- O3 Remember the appointment: frequency 2, severity 3, value 6, effort 1, medium evidence.
- O2 Ask for the right service: frequency 2, severity 2, value 4, effort 1, strong evidence.
- O4 Change a booking: frequency 2, severity 2, value 4, effort 2, medium evidence.
- O5 Give details once: frequency 2, severity 1, value 2, effort 2, medium evidence.
Plot the same rows on a simple grid, Value up the side and Effort along the bottom, so the trade-offs are visible at a glance.
Now choose three. The sort is a starting point, not the answer. Apply three tests and change the order where a test fails:
- Do not drop the top item only because it is hard. O1 is the biggest problem on the map. If every hard item is skipped, the team only ever ships small fixes. Keep it, and plan to meet it in stages (for example, show patients which days have free slots before full online booking exists).
- Check the evidence under each pick. O3 rests on two interviews. It stays in because it is cheap and the severity is high, but its row gets a note: confirm frequency with the clinic's missed-appointment figures before building.
- Look for a quick win just outside the three. O2 is low effort. It is not one of the three, but the content fix (clearer appointment types) can go to whoever owns the clinic's wording without taking design time.
Larkfield's three, in order: O1, O6, O3.
Check it worked
Your table is sorted, the top three are marked, and the order differs from a plain Value sort only where you can point to one of the three tests. Anything ranked above a chosen opportunity but not chosen has a one-line reason in a Decision column.
Step 7 · Write the three up and put them back on the map
A ranked spreadsheet is easy to ignore. Write a short summary, no longer than one page, that someone can read without the spreadsheet open. For each of the three, give:
- the opportunity statement;
- the scores and the strongest piece of evidence, quoted or counted ("4 of 6 interviews, and 61 per cent of calls before 9:30am");
- the effort note, including any dependency;
- what the team will do next (explore it, research it further, or hand a quick fix to someone).
Add a short section underneath called Not now, listing the other opportunities with their rank and one line each. People who raised them need to see they were weighed, not forgotten.
Then go back to the journey map and mark the three pain points behind the chosen opportunities (a bold outline, a number in a circle, a coloured tag) with their rank. Anyone who opens the map now sees which parts the team has decided to work on.
Check it worked
Your summary fits on one page, names exactly three opportunities with evidence and effort for each, and has a Not now list that accounts for every other row in the table. On the map, three pain points carry a rank mark and the rest do not.
Next steps
You now have three opportunities with the evidence and trade-offs written down. The next job is to open each one up for ideas without jumping straight to a solution.
- Turn each chosen opportunity into a handful of design questions with Turn a problem statement into how-might-we questions.
- Before you design for O3 or any other medium-evidence pick, list what you are taking on trust in Map your assumptions and choose which to test first.
- If your map's pain points were thin, go back to Map a current-state customer journey and strengthen the evidence before you rank again.
- For research that has not reached a map yet, start from Turn research themes into insights.
Part of these paths
Related tutorials
- Map a current-state customer journeyYou will have a journey map of how patients book, attend and follow up on a clinic appointment today, with every pain point tied to the research that shows it and every guess marked as a guess.
- Turn a problem statement into how-might-we questionsYou will have a sorted set of how-might-we questions drawn from one problem statement, with three workable questions chosen to explore and a note on why the rest were set aside.
Need this done for you?
Padding does this work for growing companies, from the first diagnosis to a system that keeps working.
Get new tutorials