UX and research · Intermediate · 16 min
Score a design with the System Usability Scale
By Padding · Updated 18 Nov 2026
Paper or any form tool, and Google Sheets or Excel · November 2026
You will have SUS scores for two versions of a design, worked out by hand and in a spreadsheet, with confidence intervals and a written statement of what the numbers do and do not show.
On this page
The System Usability Scale (SUS) is a ten-question form that people fill in straight after using a product. John Brooke wrote it in 1986 as a "quick and dirty" measure, and it has stayed in use because it is short, free to use with acknowledgement, and produces one number between 0 and 100 that you can compare across versions and over time.
That one number is easy to get wrong. Half the items are worded negatively, so adding up the raw answers gives nonsense. The score looks like a percentage and is not one. And with the five or six people in a typical usability round, the uncertainty around the number is large enough to swallow most differences between designs.
In this tutorial you add SUS to the end of your test sessions, score every form correctly, and compare two versions of a design. The running example is a fictional council library's room-booking flow: version A is the current three-page form, version B is a redesign on one page. Six different people tried each version. Swap in your own product and numbers as you go.
Step 1 · Decide what the comparison is and how many people it needs
Before you print a single form, write down three things in your research notes:
- What is being compared. Two versions of one flow, the same product before and after a release, or your product against a competitor. SUS rates the whole experience the person just had, so keep the tasks the same for every version.
- Who rates which version. Either each person tries one version only (between groups), or each person tries both (within groups). Within groups needs fewer people, but you must alternate which version comes first, or the second version benefits from practice on the first.
- How many people per version. SUS gives a stable average sooner than most questionnaires, but "stable" still means a dozen or more people per version. Five or six per version is enough to see a large gap and not enough to prove a small one. Say this to your team now, not after the results arrive.
For the library example the plan reads: "Version A vs version B of room booking. Between groups, six per version. Same three tasks. We expect to spot a large difference only; anything under about 10 points we will call unclear."
Check it worked
Your research notes have a short comparison plan with the two versions named, the design (between or within groups), the number of people per version, and one sentence on the size of difference you expect to be able to see.
Step 2 · Prepare the questionnaire
Use Brooke's ten items in this order. Each is answered on a five-point scale from 1 (strongly disagree) to 5 (strongly agree):
- I think that I would like to use this system frequently.
- I found the system unnecessarily complex.
- I thought the system was easy to use.
- I think that I would need the support of a technical person to be able to use this system.
- I found the various functions in this system were well integrated.
- I thought there was too much inconsistency in this system.
- I would imagine that most people would learn to use this system very quickly.
- I found the system very cumbersome to use.
- I felt very confident using the system.
- I needed to learn a lot of things before I could get going with this system.
Odd-numbered items are positive statements and even-numbered items are negative. The alternation is deliberate: it makes people read each item rather than ticking the same column down the page.
Rules for preparing the form:
- You may replace "system" with your product's name or a plain word such as "booking page". Change nothing else, or your scores will not compare with anyone else's.
- Keep the item order and the 1 to 5 labels exactly as above.
- Add a line at the top for the participant code and the version (A or B) so forms cannot get mixed up.
- An all-positive version of SUS also exists. It avoids the reversed items, but it is scored differently. Pick one version and use it for every participant.
Check it worked
You have one printed or online form with the ten items in Brooke's order, a 1 to 5 scale labelled at both ends, the word "system" either kept or replaced consistently, and fields for participant code and version.
Step 3 · Give it at the right moment in each session
SUS measures how the experience felt, so it goes after the last task and before you start discussing what happened. If you debrief first, people revise their answers to match what they just told you.
In each session:
- Hand over the form as soon as the last task ends. Say: "Please answer these quickly. Your first reaction is what I am after."
- Leave the room or look away while they fill it in. People mark more kindly when watched.
- If someone says they cannot answer an item, ask them to mark the middle point, 3. Brooke's instructions say to do this, and it keeps every form scorable.
- Do not explain items. If someone asks what "well integrated" means, say "whatever it means to you".
Online, put the form on the screen that follows the final task, and make every item required so you do not get half-filled forms.
Check it worked
After the first session you have a completed form with all ten items answered, the participant code and version filled in, and a note in your session log that the form was given before the debrief.
Step 4 · Score one form by hand
Score the first form on paper before you build a spreadsheet, so you know exactly what the formula is doing. Each item turns into 0 to 4 points:
- Odd items (1, 3, 5, 7, 9): points = answer minus 1. Agreeing with a positive statement is good.
- Even items (2, 4, 6, 8, 10): points = 5 minus answer. Disagreeing with a negative statement is good.
Add the ten point values to get a total from 0 to 40, then multiply by 2.5 to get the SUS score from 0 to 100.
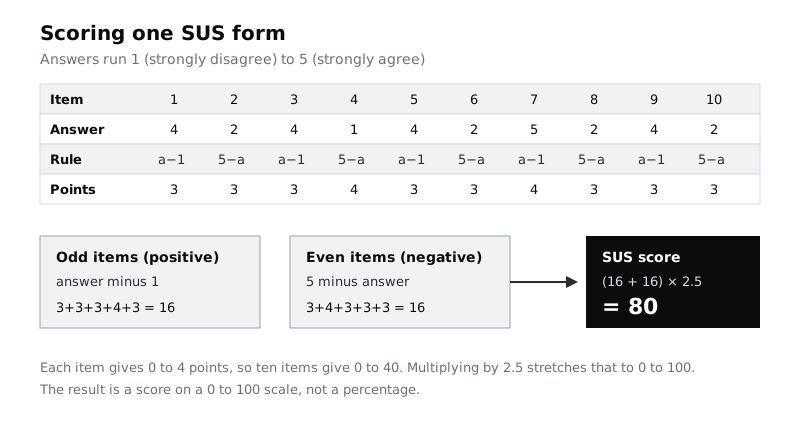
For participant A1 the answers were 4, 2, 4, 1, 4, 2, 5, 2, 4, 2:
- Odd items: 4, 4, 4, 5, 4 become 3, 3, 3, 4, 3, which sum to 16.
- Even items: 2, 1, 2, 2, 2 become 3, 4, 3, 3, 3, which sum to 16.
- (16 + 16) × 2.5 = 80.
Two quick sanity checks catch most mistakes. A valid score is always a multiple of 2.5. And a form with every answer the same (all 3s, or all 5s) always scores exactly 50. If you see a straight line of 5s, the person did not read the negative items, and the 50 tells you nothing about the design. Keep the form, but note it.
Check it worked
Your first form has a points value written next to each item, an odd subtotal, an even subtotal and a final score that is a multiple of 2.5 between 0 and 100. If you used A1's answers above, you got 80.
Step 5 · Build a scoring sheet
Set up one row per participant in Google Sheets or Excel:
- Column A: participant code (A1, A2 ... B6)
- Column B: version (A or B)
- Columns C to L: the raw answers to items 1 to 10
- Column M: the SUS score
In M2 enter this formula and fill it down:
=2.5*((C2+E2+G2+I2+K2-5)+(25-(D2+F2+H2+J2+L2)))The first bracket is the odd items minus 1 each (five items, so minus 5). The second is 5 minus each even item (five items, so 25 minus their sum). It is the same rule you used by hand, written once.
Add a column N that flags rows needing a second look, for example forms where every answer is identical:
=IF(MIN(C2:L2)=MAX(C2:L2),"same answer throughout","")The library study's scores came out as:
- Version A: 80, 62.5, 70, 55, 72.5, 67.5
- Version B: 85, 77.5, 72.5, 90, 65, 80
Check it worked
Row A1 in your sheet shows 80 in column M, matching your hand score. Every score in column M is a multiple of 2.5, and column N is blank for every row or flags only forms you already know about.
Step 6 · Summarise each version with an interval, not just an average
An average on its own hides how much it could move with different people. Add a small summary block under the data for each version. With version A's scores in M2:M7:
Mean:         =AVERAGE(M2:M7)
Std dev:      =STDEV(M2:M7)
Margin (95%): =CONFIDENCE.T(0.05, STDEV(M2:M7), COUNT(M2:M7))
Low:          mean minus margin
High:         mean plus margin
For the library study:
- Version A: mean 67.9, standard deviation 8.6, 95% interval 58.9 to 76.9
- Version B: mean 78.3, standard deviation 8.9, 95% interval 69.0 to 87.7
The margin is about 9 points either side for both versions. That is what six people buys you. With the same spread and 24 people per version, it would shrink to roughly 4 points, because the margin falls with the square root of the number of people.
A rough reference point: across hundreds of published studies the average SUS score sits around 68. A score of 68 is "middle of the pack", not "68% usable". Version A is right on that average; version B is above it, but its lower bound (69) is barely clear of it.
Check it worked
Your sheet has a summary block for each version showing mean, standard deviation, margin, low and high. For the library data the version A interval reads 58.9 to 76.9.
Step 7 · Compare the two versions
Now ask whether the gap between the versions is larger than chance would produce. Plot the two intervals side by side first; it is the fastest way to see the situation.
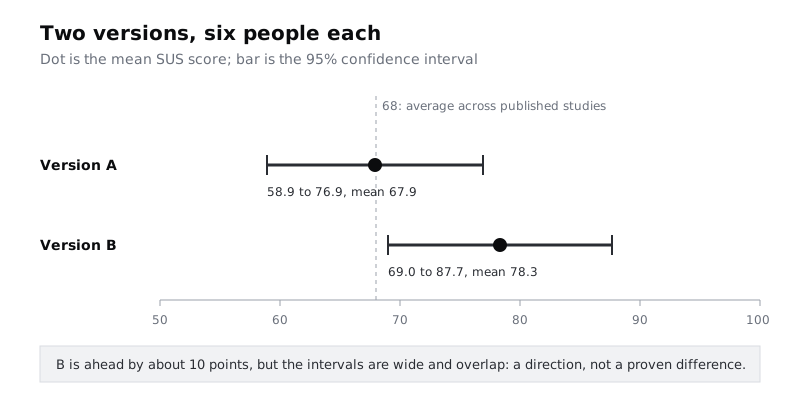
Then run a test. For two separate groups of people, use Welch's t-test:
=T.TEST(A_scores, B_scores, 2, 3)Replace A_scores and B_scores with the two ranges. The 2 asks for a two-tailed test (B could be better or worse) and the 3 picks the version that does not assume equal spread. If the same people rated both versions, use type 1 (paired) instead, with each person's two scores on the same row.
For the library data the result is about 0.07. In plain words: if the two designs were truly equal, a gap of 10 points or more would turn up in roughly 7 of every 100 studies this size. That is suggestive, not convincing. The usual 0.05 line is a convention rather than a law, but nobody should treat 0.07 from six people a side as settled.
Do not read individual items as findings. Brooke is explicit that single item scores are not meaningful on their own; the ten items work as one scale. If you want to know why B scored higher, look at your task results and session notes, not at item 7.
Check it worked
Your sheet shows the T.TEST result next to the two summaries, and your chart or sketch shows both intervals on the same axis. For the library data the p-value is about 0.07 and the intervals overlap between 69 and 77.
Step 8 · Write the result down honestly
Write the result as a short paragraph your team can paste into a report. It should give the scores, the intervals, the sample size, what the comparison suggests, and what would settle it. For the library study:
Version B (one-page booking) scored a mean SUS of 78 (95% interval 69 to 88) and version A (current three-page form) scored 68 (59 to 77), from six participants per version. B is ahead by about 10 points, which matches the session notes, where four of six A participants lost their place between pages. With six people each, the difference could still be chance (p about 0.07). We treat B as the likely better design and will confirm with a further 12 participants per version in the next round. A is at the cross-study average of about 68; B is above it.
Things to leave out: percentages ("B is 15% more usable"), letter grades without saying which grading scale you used, and averages of individual items.
Things to keep alongside the scores: the raw sheet, the exact item wording you used, and any forms you flagged in column N, so the next round can be scored the same way and compared.
Check it worked
Your report has a paragraph that names both means, both intervals, the number of people per version, the p-value or a plain statement that the difference is unclear, and the next step that would settle it. It contains no percentages and no item-by-item scores.
Next steps
- Run the sessions that feed this questionnaire with Run a five-person usability test.
- Avoid the common traps in summarising any survey with Read survey results without fooling yourself.
- Decide which problems to fix first with Rate and prioritise usability problems by severity.
- Plan the next round's tasks and success criteria with Plan a usability test with tasks and success criteria.
Part of these paths
Related tutorials
- Run a five-person usability testYou will run five in-person think-aloud sessions on a live product in one day, hold back from helping when people struggle, and finish with a list of observed problems showing how many of the five hit each one.
- Read survey results without fooling yourselfYou will check who answered your survey, put a margin of error on each headline number, decide which group differences are too small to report, and write a results summary that states its own limits.
Need this done for you?
Padding does this work for growing companies, from the first diagnosis to a system that keeps working.
Get new tutorials