UX and research · Intermediate · 14 min
Use analytics to decide what to research next
By Padding · Updated 18 Nov 2026
Any product analytics tool with a funnel report, and a spreadsheet · November 2026
You will turn a booking flow's funnel and event data into two or three research questions, each tied to a specific number, a specific group of people and a method that can answer it.
On this page
Analytics tells you what people did. It cannot tell you what they were trying to do, what they expected to see, or what they did instead after closing the tab. That gap is exactly where user research earns its time, and it is also why research without numbers often aims at the wrong screen. Teams interview five people about the whole product when 80% of the loss happens on one step.
This tutorial uses analytics to aim research, not to replace it. You will read a funnel, check that the worst drop is real, narrow it to the people and moments where it happens, and write research questions that the numbers raise but cannot answer. You finish with two or three questions, each with the evidence behind it and a method to answer it.
The worked example is a fictional physiotherapy practice with an online booking flow of five screens: Choose a service, Pick a time, Your details, Confirm and Booked. The numbers are invented but shaped like real booking data. Swap in your own flow and figures as you go.
Step 1 · Write down the decision the research must inform
Open a new spreadsheet and name the first sheet "Brief". Before you look at any chart, write three lines at the top:
- Flow: the one journey you are looking at, with its start and end ("Online booking, from Choose a service to Booked").
- Decision: what the team will decide in the next few weeks that research could change ("Whether to redesign the time picker this quarter or move on to reminders").
- Date range: a fixed window you will use for every number ("1 to 28 October 2026, four full weeks").
The decision line stops you from collecting interesting facts that change nothing. The fixed date range stops numbers from different weeks being compared as if they were the same. Four whole weeks is a sensible default because it covers every weekday the same number of times; avoid ranges that include a launch, an outage or a holiday unless that is what you are studying.
Check it worked
Your "Brief" sheet has a flow with a named first and last step, a decision someone on the team would recognise as theirs, and a date range with a start and end date. If you cannot name the decision, stop here and ask your product manager; research aimed at no decision tends to end up in a slide nobody acts on.
Step 2 · List the events that mark each step
A funnel is only as good as the events behind it. In a second sheet called "Events", make one row per step of the flow with three columns: the step name, the event or page view that means someone reached it, and a note on how it fires.
For the booking example:
| Step | Event | Fires when |
| --- | --- | --- |
| Choose a service | booking_service_viewed | Service list loads |
| Pick a time | booking_time_viewed | Calendar loads after a service is chosen |
| Your details | booking_details_viewed | Details form loads after a slot is chosen |
| Confirm | booking_confirm_viewed | Summary loads after details pass validation |
| Booked | booking_completed | Server confirms the appointment |
Look up each event in your analytics tool's event list (or ask whoever set up tracking) and confirm it exists, has data in your date range, and fires once per visit to the screen rather than on every re-render. Note any step with no clean event. A missing event is a finding in itself: you cannot research a drop you cannot see.
If your tool only offers page URLs, use those, but check that a single URL does not cover two steps. A one-page booking form that shows the calendar and the details fields at once cannot be split into two funnel steps from page views alone.
Check it worked
Every step in your "Events" sheet has an event name and a one-line "fires when" note, or is marked "no event" with a reason. You have seen each event's count for your date range at least once, so you know none of them reads zero by mistake.
Step 3 · Build the funnel and find the biggest loss
Create a funnel report in your analytics tool using those events in order, counting unique people (not sessions or events) over your date range. Copy the counts into a third sheet called "Funnel" with these columns: step, people reaching it, people lost before the next step, and step conversion.
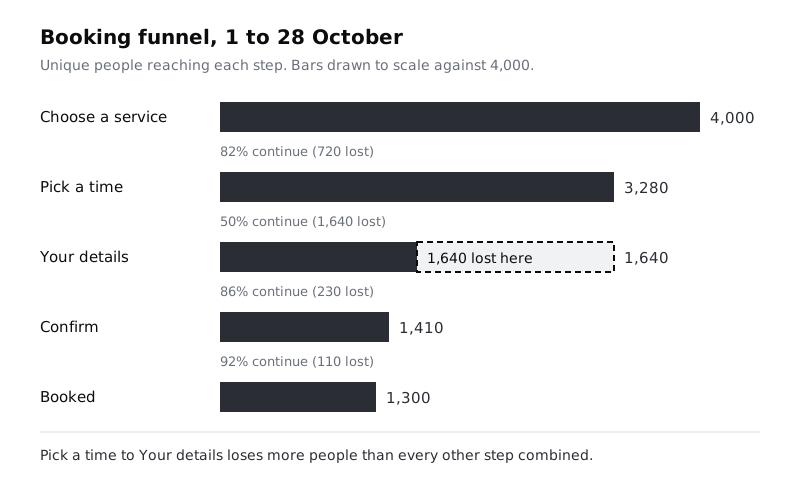
For the example, the sheet reads:
| Step | People | Lost before next step | Continue |
| --- | --- | --- | --- |
| Choose a service | 4,000 | 720 | 82% |
| Pick a time | 3,280 | 1,640 | 50% |
| Your details | 1,640 | 230 | 86% |
| Confirm | 1,410 | 110 | 92% |
| Booked | 1,300 | | |
Overall, 1,300 of 4,000 people book: 33%. Sort by the "lost" column, not by the percentage. A step with 60% conversion that 200 people reach matters less than one with 80% conversion that 5,000 reach. Here, Pick a time loses 1,640 people, more than the other three transitions combined (1,060).
Check it worked
Your "Funnel" sheet has one row per step, the counts add up (each step's people minus its lost equals the next step's people), and one row is highlighted as the largest absolute loss. Write a one-sentence note under the table: "Pick a time loses 1,640 of 3,280 people (50%), the largest drop in the flow."
Step 4 · Rule out tracking and data problems
Before anyone spends a week interviewing patients about the calendar, make sure the drop is real. Go through these checks and write the answer to each in a "Sanity checks" block under your funnel:
- Did tracking change? Ask whether any event was renamed, moved or added during your date range. A drop that starts on the day of a release is often a broken event, not a broken screen.
- Is the next event firing? Pick five recent sessions where someone reached Pick a time and then booked (from your own test bookings or a session list, if your tool has one). Each should show
booking_details_viewed. If some skip it, the funnel undercounts. - Is it stable? Compare the same funnel for the four weeks before. If Pick a time converted at 50% then too, the problem is long-standing. If it was 75%, something changed, and the release notes are your first research source.
- Are bots or staff in it? Filter out internal traffic and known bots if your tool supports it, and see whether the conversion moves by more than a couple of points.
- Does the funnel allow other routes? Some people leave the funnel and book by phone. That still counts as a lost online booking, but note it: it changes what "lost" means.
If any check fails, fix the data first and rebuild the funnel. Research questions built on a broken event waste participants' time as well as yours.
Check it worked
Your "Sanity checks" block has an answer for each of the five checks. You can say in one sentence whether the drop is long-standing or recent, and the previous period's conversion for the worst step is written beside this period's.
Step 5 · Narrow the drop to who and when
A 50% drop across everyone usually hides a much worse drop for one group and a fine experience for another. Break the worst step down by three or four segments that your tool records and that could plausibly change behaviour. Good first choices are device type, new versus returning visitors, the service chosen, and where people arrived from. Add a "Segments" sheet with people reaching the step, people continuing, and the rate for each segment.
For the example:
| Segment | Reach Pick a time | Continue | Rate |
| --- | --- | --- | --- |
| Phone | 2,300 | 1,000 | 43% |
| Desktop | 980 | 640 | 65% |
| New visitors | 2,100 | 840 | 40% |
| Returning visitors | 1,180 | 800 | 68% |
| New visitors on phones (both filters) | 1,500 | 480 | 32% |
Check each pair adds back to the total (2,300 + 980 = 3,280 reach; 1,000 + 640 = 1,640 continue). Two groups stand out: phones and new visitors. The last row combines both filters, and it is not part of a pair: it is a subset of each, so it must be smaller than both (1,500 is under 2,100 and 2,300). If your tool lets you combine filters, add a row like this; that is often where the sharpest loss sits. Here, new visitors on phones continue at 32%, well below either group on its own.
Keep the segment list short. If you slice by ten attributes, one of them will look dramatic by chance. Pick the segments before you look at the results, and treat a difference of a few points between small groups (a few hundred people or fewer) as noise until something else backs it up.
Check it worked
Your "Segments" sheet has two to four segment pairs for the worst step, each pair adds back to the funnel totals, any combined row is smaller than both groups it comes from, and you have marked the one or two groups whose rate is clearly lower than the rest. You can name them in a phrase, such as "new visitors on phones".
Step 6 · Look at what people do on the step before they leave
The funnel shows where people leave. Event data on the step itself shows what they were doing just before. Look for events that happen on the worst screen and compare people who continued with people who left. Useful signals, if you track them:
- Time on step: the median for leavers versus continuers.
- Repeated actions: paging to the next week, changing the service, reopening a filter.
- Empty or error states: an event that fires when no slots show, or when a slot is taken while someone is choosing.
- Back navigation: returning to the previous step instead of moving forward.
Add a "Behaviour" sheet and write each signal as a plain statement with its numbers. For the example:
- Of the 1,640 who left at Pick a time, 610 (37%) saw the "No times this week" message at least once.
- Leavers spent a median of 74 seconds on the step; people who continued spent 21 seconds.
- 44% of leavers moved forward by one week or more before leaving, against 12% of continuers.
Each line is a fact about behaviour, not an explanation. "37% saw no times" does not mean "37% left because there were no times". Some of them may have wanted a weekend slot that never existed, or been checking availability for a relative. Resist writing the reason; that is what research is for.
If you have session recordings, watch ten from the leaving group, chosen at random rather than the most dramatic ones. Note what you see in the same factual style. Recordings still show only behaviour, so they belong here, not in place of talking to people.
Check it worked
Your "Behaviour" sheet has two to five statements, each with a count or a percentage and a comparison between people who left and people who continued. None of the statements contains "because".
Step 7 · Turn each pattern into a research question
Now write the questions the numbers raise but cannot answer. A good research question here has four parts: who (the segment), where (the step), the behaviour (from your data), and what you want to understand about it. It should be answerable by watching or talking to people, and it should not be answerable by another query in your analytics tool.
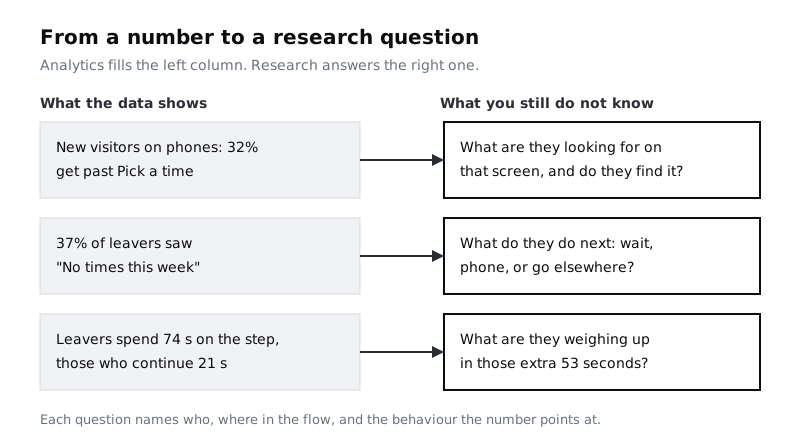
Add a "Questions" sheet. For the example, the first drafts might read:
- When new visitors on phones reach Pick a time, what are they looking for, and what stops them choosing a slot?
- After seeing "No times this week", what do people do: page forward, give up, phone the practice, or book somewhere else?
- What are leavers weighing up during the extra 53 seconds they spend on the calendar?
Then test each draft against three filters, and rewrite or drop it if it fails:
- Can analytics answer it? "How many people page forward more than three weeks?" is a query, not a research question. Run the query and move on.
- Is it a solution in disguise? "Would people prefer a list of times instead of a calendar?" assumes the answer. Ask about the need instead, and test options later.
- Is it tied to a number? Every question should point to a line in your "Funnel", "Segments" or "Behaviour" sheet. Write the reference beside it.
Check it worked
Your "Questions" sheet has three to five draft questions. Each names a group of people and a step, cites a line from an earlier sheet, and would still be open after any query you could run in your analytics tool.
Step 8 · Rank the questions and choose a method for each
You rarely have time to answer every question. Score each one in your "Questions" sheet on three columns from 1 to 3:
- Size: how many people the behaviour affects (from your counts).
- Decision fit: how directly the answer changes the decision on your "Brief" sheet.
- Uncertainty: how little the team already knows. A question everyone can confidently answer scores 1.
Add the three scores and keep the top two or three. For each, add a method column with the lightest method that can answer it, and a "what we will measure afterwards" column with the funnel number you expect to move if the research leads to a change. For the example:
| Question | Size | Fit | Uncertainty | Method | Measure afterwards |
| --- | --- | --- | --- | --- | --- |
| What new visitors on phones look for on Pick a time | 3 | 3 | 3 | Five moderated sessions with new patients on phones, booking a real service | Pick a time continue rate, new visitors on phones (32%) |
| What people do after "No times this week" | 2 | 3 | 2 | Short exit question on the empty state, then five follow-up calls | Share of leavers who saw the empty state (37%) |
| What leavers weigh up in the extra time | 2 | 2 | 3 | Fold into the moderated sessions above | Median time on step for leavers (74 s) |
The third question folds into the first study, which is a common result: two questions, one study, and a clear number to check once the team acts on what it learns.
Check it worked
Your "Questions" sheet ends with two or three questions marked as chosen, each with a score, a named method with a participant count, and a baseline number copied from your funnel or segment sheets. Someone reading only that sheet can tell what you will study, with whom, and how you will know whether the change it leads to worked.
Next steps
Your chosen questions and their evidence are the core of a research plan. Put them into one page with participants, schedule and owners in Write a one-page research plan. If the first question leads to moderated sessions, Plan a usability test and Write an interview guide without leading questions cover the study itself. Once you have results, bring them back to the numbers with Combine interview and analytics findings into one story.
Part of these paths
Related tutorials
- Combine interview and analytics findings into one storyYou will have one finding that rests on both interviews and product data, with a confidence level, the reason for any disagreement between the two, and a note on what evidence would change it.
- Write a one-page research planYou will have a research plan that fits on one page, with every question tied to a decision, and a stakeholder sign-off you got in a five-minute read.
Need this done for you?
Padding does this work for growing companies, from the first diagnosis to a system that keeps working.
Get new tutorials