UX and research · Advanced · 17 min
Combine interview and analytics findings into one story
By Padding · Updated 18 Nov 2026
Any notes app, a spreadsheet and your product analytics tool · November 2026
You will have one finding that rests on both interviews and product data, with a confidence level, the reason for any disagreement between the two, and a note on what evidence would change it.
On this page
Interviews and analytics answer different halves of a question. Analytics tells you what thousands of people did and how often. Interviews tell you what a handful of people meant, believed and tried to do. Put side by side, they either back each other up, which lets you state a finding with more confidence than either could alone, or they disagree. The disagreement is the useful part. It usually means one source is measuring something other than what you assumed, and finding out which one is how you avoid shipping a fix for the wrong problem.
This tutorial takes you from two separate piles of evidence to one written finding. You line up the claims, sort them into agreements, conflicts and gaps, work out why each conflict exists, run one small check, and write the result with a confidence level and a statement of what would prove it wrong.
The worked example is a city bus ticket app. The team wants to know why frequent riders keep buying single tickets instead of the cheaper weekly pass. They have eight interviews with riders who make four or more trips a week, and 30 days of purchase and screen-view events. The numbers in the example are invented for teaching; use your own as you go.
Step 1 · Write one question both sources must answer
Most failed attempts at combining research start with two reports written for different questions. Before you open either source, write a single question at the top of a new spreadsheet tab called Question. It needs three parts:
- Who: the group you care about, defined in a way the analytics can filter. "Frequent riders" is vague. "Riders with 16 or more trips in the last 30 days" can be queried.
- What behaviour: something the analytics records as an event. "Buys a single ticket when a weekly pass would cost less" is recordable. "Feels the pass is good value" is not.
- Why or what stops them: the part interviews answer.
For the bus app the question becomes: "Why do riders with 16 or more trips in the last 30 days buy single tickets instead of a weekly pass, when the pass would have saved them money?"
Then check that your interviewees belong to the same group. Write each participant code with their trip count, either from what they told you or from their account if you have consent to look it up. Mark anyone who falls outside the definition. Their quotes can still inform the work, but they do not count as evidence for this question.
Check it worked
Your Question tab has one question with a who, a behaviour and a why. You can name the exact filter you would type into the analytics tool for the "who". Every interview participant has a trip count next to their code, and any who fall outside the group are marked.
Step 2 · List the claims from each source in one sheet
Create a tab called Claims with these columns:
- ID: Q1, Q2 for qualitative claims; A1, A2 for analytics claims
- Source: Interviews or Analytics
- Claim: one sentence, stated as plainly as you can
- Evidence: participant codes for interviews; the metric, filter and date range for analytics
- Base: how many people the claim rests on (6 of 8; 3,140 users)
- Kind: Behaviour (what people did) or Opinion (what people said they think)
Write each claim so it could be wrong. "Riders find the pass confusing" is hard to test. "Five of eight participants could not say what the weekly pass costs" is a fact you can check against your notes.
From the bus app:
- Q1 Six of eight said the weekly pass is "not worth it" or "only worth it if you ride every day". Opinion.
- Q2 Five of eight could not name the price of the weekly pass. Behaviour (what they knew when asked).
- Q3 Three of eight did not know the app sells passes. Behaviour.
- Q4 Seven of eight open the app, tap the last ticket they bought, and pay. Behaviour (observed in a walkthrough).
- A1 3,140 riders had 16 or more trips in the 30 days; 83% of their purchases were single tickets.
- A2 24% of those riders opened the pass screen at least once in the 30 days.
- A3 Of the riders who opened the pass screen, 31% bought a pass in the same period.
Keep analytics claims in rates with their base. "24% of 3,140" can be compared with "3 of 8"; a bare "750 riders" cannot.
Check it worked
Your Claims tab has at least four interview claims and three analytics claims. Every row has a base, and every analytics row names the metric, the filter and the date range. Read each claim aloud: if you cannot say what result would make it false, rewrite it.
Step 3 · Sort the claims into agree, conflict and gap
Now pair claims across the two sources. Add a tab called Matrix and give each pairing a row: the interview claim ID, the analytics claim ID, and a Relationship column with one of three values.
- Agree: both point the same way. Q3 (three of eight did not know passes exist) and A2 (three in four never opened the pass screen) agree: most frequent riders never look at the pass.
- Conflict: they point different ways. Q1 says riders reject the pass on value. A2 says most riders never see the pass, so they cannot have judged its value in the app. Both cannot be the main reason.
- Gap: only one source speaks to it. Q4 (riders repeat their last ticket) has no matching analytics claim yet. A3 (31% of viewers buy) has no matching interview claim.
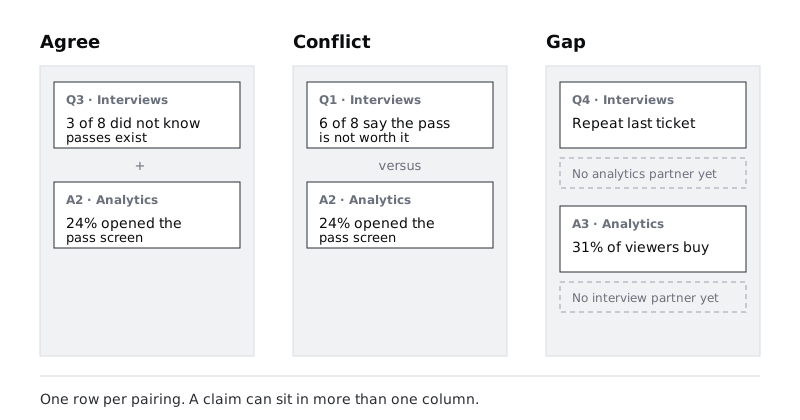
One claim can appear in more than one row. A2 agrees with Q3 and conflicts with Q1; that is normal, and it tells you A2 is central to the story.
Gaps are not failures. They are a list of things to check, and some of them become the quickest way to settle a conflict in the next step.
Check it worked
Every claim from the Claims tab appears in at least one Matrix row. You have at least one Conflict row. If you have none, look again at the opinion claims: interview opinions and analytics behaviour disagree more often than a first read suggests.
Step 4 · Find the reason for each conflict
A conflict between interviews and numbers almost always has one of five causes. Work through them in this order for each Conflict row, and write the cause you settle on in a Why column.
- The data is wrong. An event is missing, fires twice, or does not fire on every route into a screen. For the bus app: does the pass screen event fire when a rider reaches it from a promotion link, or only from the menu? Ask whoever owns the tracking, or open the screen yourself in a test account and look for the event in the live view.
- Different people. The interviewees are not the group the numbers describe. Eight riders recruited through a social media post may skew towards people with strong opinions about fares.
- Different definitions. One source counts sessions, the other counts people; one counts "opened the screen", the other counts "understood the offer". Write both definitions out side by side.
- Say versus do. People explain their behaviour with a reason that sounds sensible, not always the one that drove it. "Not worth it" can be a judgement made without ever looking at the price.
- Both are true for different subgroups. Some riders reject the pass on value; a larger number never meet it. The total hides the split.
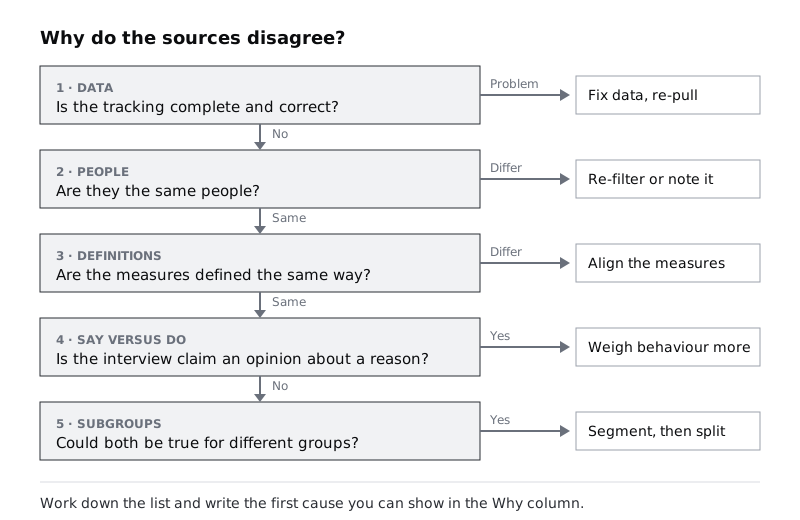
In the bus example, the tracking checked out and the interviewees all had 16 or more trips. Cause 4 looked likely: Q1 is an opinion and Q2 shows most people did not know the price. Cause 5 was also possible, because A3 shows that a third of people who did see the pass bought it.
Check it worked
Every Conflict row has a Why entry naming one of the five causes, with a sentence of evidence for it. For cause 1, you have asked someone or tested the event yourself, not assumed the tracking is correct.
Step 5 · Run one small check to settle it
Pick the check that would most change your finding, and that you can do this week without a new study. Good options:
- Re-read the transcripts with a sharper question. For the bus app: of the six who said the pass was not worth it, how many could name its price? The answer was two. Four were judging a price they did not know.
- Segment the analytics. Split the group by a property the interviews suggested matters. Riders who opened the pass screen and saw the price bought at 31%; that is a different population from the 76% who never opened it.
- Turn a gap into a claim. Q4 says riders reorder their last ticket. Count how many frequent-rider purchases start from the "buy again" control. If the share is high, the pass is never on the route most people take.
- Ask two or three participants one follow-up question by message, if your consent covers recontact.
Add each result to the Claims tab as a new row (Q5, A4) and update the Matrix. In the bus example, A4 showed 78% of frequent-rider purchases started from "buy again", which agreed with Q4 and closed that gap.
Do not keep checking until every conflict disappears. One or two checks that address the biggest conflict are enough to write a finding; the rest go in the note on what would change it.
Check it worked
Your Claims tab has at least one new row from the check, with its base and source. The Conflict row you targeted now has an updated Why, and you can say in one sentence whether the check supported or weakened your leading explanation.
Step 6 · Write the combined finding and rate your confidence
Write the finding in a new tab called Finding. Use four parts:
- What happens, with a number from the analytics.
- Why, from the interviews, with a count of participants.
- How the two fit, including any part of the conflict that remains.
- Confidence: High, Medium or Low, with a reason.
For the bus app:
Frequent riders buy single tickets mainly because they never compare them with the pass. 76% of riders with 16 or more trips in 30 days never opened the pass screen, and 78% of their purchases start from "buy again", which does not show the pass. In interviews, most who called the pass poor value could not name its price (4 of 6). Among riders who do see the pass, 31% buy one, so price is a real objection for some, but it is not the main barrier. Confidence: Medium.
Set the confidence level with these rules:
- High: both sources agree, the conflicts are explained by evidence you have shown (not assumed), and the analytics base is large enough that a few hundred users either way would not change the direction.
- Medium: the sources agree on the main point, but at least one conflict is explained by a likely cause you have not proved, or the interview base is small.
- Low: the sources disagree and you cannot yet say why, or the finding rests mostly on one source.
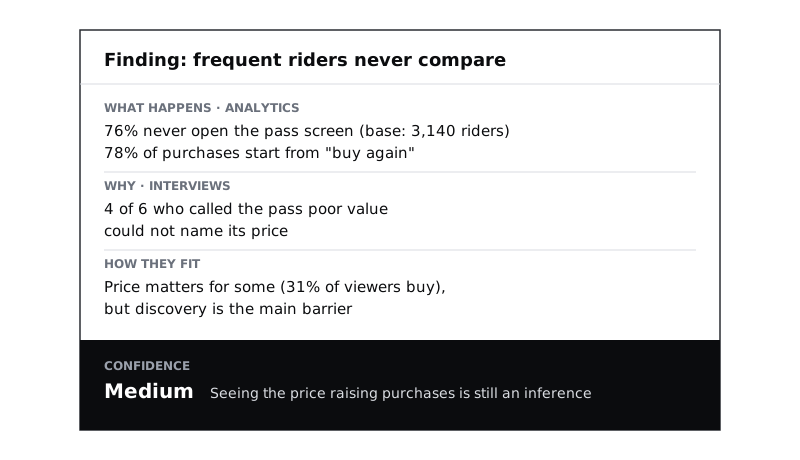
The bus finding is Medium, not High, because "riders would buy if they saw the price" is still an inference. Nobody has shown the price on the buy-again route and measured what happens.
Check it worked
Your Finding tab has one finding of no more than six sentences. It contains at least one analytics number with its base and at least one participant count. The confidence level has a reason that refers to a specific row in your Claims or Matrix tab.
Step 7 · Write what would change the finding
A finding without a way to be wrong turns into an assumption the team stops questioning. Under the finding, add a short section titled What would change this. List two to four specific results, each tied to evidence someone could collect.
For the bus app:
- If showing the pass price on the buy-again screen does not raise pass purchases among frequent riders over four weeks, discovery is not the main barrier and value moves to the front.
- If the tracking owner finds the pass screen event misses entries from promotion links, A2 is understated and the "never see it" part weakens.
- If interviews with riders who saw the pass and still bought singles show a reason other than price (cash flow at the start of the week, unpredictable shifts), the value objection needs its own finding.
Then add the date and the evidence it rests on, by ID: "Rests on Q1 to Q5, A1 to A4. Written 18 November 2026." When new data arrives, anyone can see which rows it touches.
Check it worked
Your Finding tab has a What would change this section with at least two items. Each item names a measurable result and a way to get it. The finding lists the claim IDs it depends on and the date it was written. Read the finding to a colleague who has not seen either source: they should be able to tell you what the team believes, how sure it is, and what would make it think again.
Next steps
If you have analytics but have not yet decided what to ask in interviews, start with Use analytics to decide what to research next, which uses drop-off data to aim a study.
To sharpen the interview half of your evidence before you combine it, work through Turn research themes into insight statements.
When the finding is ready to share, Report research findings so the team acts covers how to present it with a recommendation that matches its confidence.
If part of your evidence comes from a survey rather than event data, Read survey results without fooling yourself shows the checks to run on those numbers first.
Part of these paths
Related tutorials
- Use analytics to decide what to research nextYou will turn a booking flow's funnel and event data into two or three research questions, each tied to a specific number, a specific group of people and a method that can answer it.
- Turn research themes into insight statementsYou will have five insight statements, each saying what people do, why they do it and what it means for the design, with quotes from several participants and a confidence level beside it.
Need this done for you?
Padding does this work for growing companies, from the first diagnosis to a system that keeps working.
Get new tutorials