UX and research · Advanced · 17 min
Choose UX metrics for a feature with the HEART framework
By Padding · Updated 18 Nov 2026
Any notes app and a spreadsheet, plus read access to your product analytics · November 2026
You will have a short metrics table for one feature, with a goal, signal, metric, baseline and owner for each HEART category you kept, and a written reason for each one you dropped.
On this page
After a launch, someone always asks "how is it doing?" If nobody decided beforehand what "doing well" means, the answer becomes whatever chart happens to be open: page views, daily active users, a count of sign-ups. Those numbers are easy to collect and rarely tell you whether people can do the thing the feature exists for.
HEART is a checklist that a team at Google published in 2010 for choosing user-centred metrics. It names five kinds of thing worth measuring: Happiness (how people feel about it), Engagement (how much they use it), Adoption (how many start using it), Retention (how many keep using it) and Task success (whether they can do the job quickly and without errors). For each one you keep, you write a goal, find a signal that shows the goal is being met, and turn that signal into a metric you can track.
The part most write-ups skip is the leaving out. HEART is a menu, not a form to fill in. A feature measured on all five categories usually ends up with two or three metrics that mean nothing for it and pull attention from the ones that do. This tutorial spends a full step on deciding which categories do not apply, and why.
The worked example is the appointment booking feature in the Larkfield Clinic app. Larkfield Clinic is a fictional community clinic. A patient opens the app on Home, goes to Choose a service, then Pick a time, fills in Your details, checks everything on Confirm, and lands on Booked, after which the app sends a reminder before the appointment. Until now, patients booked by phoning reception. Follow along with your own feature in a second column.
Step 1 · Pin down what the feature is for
Metrics drift when the feature's purpose is vague. Before opening the framework, write two lines in your notes:
- The job: what a person comes to this feature to get done, in their words, not yours. For Larkfield: "Get an appointment at a time I can make, without phoning."
- The change the business wants: what should be different once it works. For Larkfield: "Fewer booking calls to reception, and fewer missed appointments."
Then draw the boundary. Name the first and last screen that count as "the feature". For Larkfield that is Choose a service to Booked, plus the reminder. Home is shared with other features, so a change in Home traffic says little about booking.
If your two lines disagree with each other, stop and resolve it with your product manager now. A booking flow built to cut phone calls and one built to fill empty slots would choose different metrics.
Check it worked
Your notes have a one-sentence job written from the user's side, a one-sentence business change, and a named first and last screen. Someone outside the team could read the three lines and say what the feature is for.
Step 2 · Decide which HEART categories to keep and which to drop
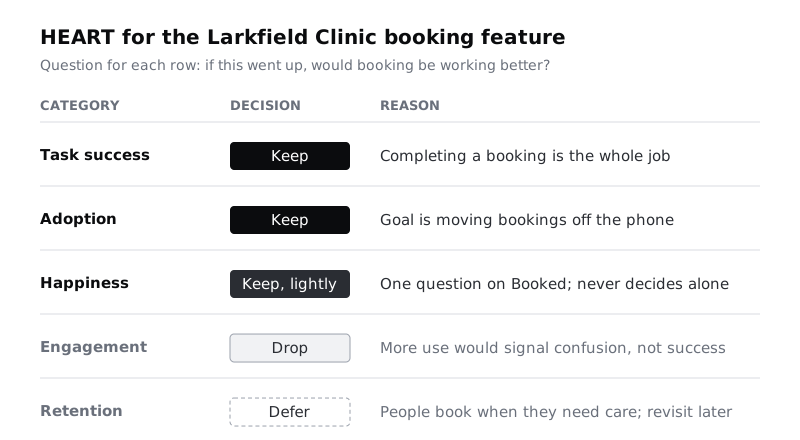
Make a table with five rows, one per category, and three columns: Category, Keep, drop or defer, Reason. Work through each row with one question: "If this number went up, would it mean the job from the last step is being done better?"
For the Larkfield booking feature:
- Task success: keep. The whole job is completing a booking. Whether people reach Booked, how long it takes and where they get stuck are the core of it.
- Adoption: keep. The business change is moving bookings off the phone. The share of bookings made in the app is the clearest measure of that.
- Happiness: keep, lightly. A patient can complete a booking and still find it stressful, especially when booking for a sick child. One short question is worth having, but it should not drive decisions on its own.
- Engagement: drop. Nobody wants to book appointments more often. More sessions or more time in the booking flow would more likely mean confusion or repeated failed attempts than success. A rising engagement number here would be a warning, not a win.
- Retention: defer. Patients book when they need care, which might be once a year. Whether someone comes back is mostly about their health, not the app. Revisit after six months, when you can ask a narrower question: "Of patients who booked in the app once, how many used the app again for their next booking rather than the phone?" That is really adoption over a longer window.
The pattern to notice: engagement and retention suit products people are meant to return to often, such as a messaging app or a reading app. For transactional features that people use when they must (booking, paying a bill, filing a claim), they tend to measure the wrong thing. For a feed or a content product, the opposite can be true: task success matters less and engagement matters more.
Keep the dropped rows in the table. The written reason is what stops someone adding "weekly active users" to the dashboard three months later.
Check it worked
Your table has five rows, each with a decision and a one-line reason that refers back to the job you wrote in the first step. At least one row is marked drop or defer. If all five say keep, go back and ask the "if this went up" question again for engagement and retention.
Step 3 · Write one goal per kept category
A goal says what a good outcome looks like for people, in plain words, without a number. It is the thing the metric will stand in for, so it has to be specific enough to be wrong.
For Larkfield:
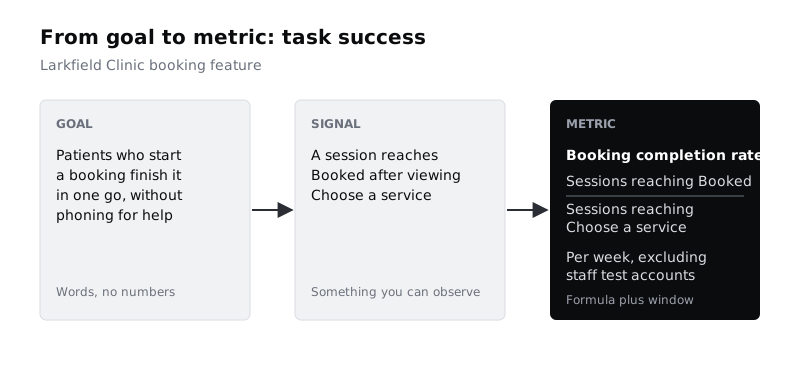
- Task success: "Patients who start a booking finish it in one go, without needing to phone for help."
- Adoption: "Most patients who book choose the app over the phone."
- Happiness: "Patients feel confident their appointment is booked correctly."
Read each goal and remove anything that is really a solution ("patients use the new calendar picker") or a vanity outcome ("patients love the app"). A goal should survive a redesign of the screens.
If you find yourself writing two goals for one category, pick the one closest to the job. Two goals usually means two metrics, and you are trying to end with few.
Check it worked
Each kept category has exactly one goal sentence in your notes. None of the goals contains a number, a screen name or a UI element. Each could still be true if the feature were rebuilt from scratch.
Step 4 · Find the signals that show each goal is being met
A signal is something you can observe, in behaviour or in what people tell you, that would change if the goal were being met. List every candidate first, then pick.
For each goal, ask: "What would I see if this were going well? What would I see if it were going badly?" Then check whether you can actually record it. This is where your list of existing analytics events earns its place.
For Larkfield task success, the candidates are:
- A session reaches Booked after starting at Choose a service. (Recorded: both screen views exist.)
- Time from Choose a service to Booked. (Recorded: both have timestamps.)
- Patients go back from Your details to Pick a time, which may mean the slot vanished while they typed. (Recorded as screen views, but needs care to read.)
- Validation errors on Your details. (Not recorded today. Needs a new event.)
- Calls to reception that start "I tried to book in the app". (Not in analytics. Reception could tally them for four weeks.)
Mark each candidate as available now, needs a new event or needs a manual source. Then choose the one or two signals per goal that are closest to the goal and cheapest to trust. For Larkfield task success, pick completion (available now) and validation errors (needs a new event, worth asking engineering for before launch).
For adoption, the honest signal is not inside the app: it is the clinic's booking system, which knows whether each appointment was made by app or by phone. Ask for that field. For happiness, the signal is a single question on the Booked screen.
Check it worked
Each goal has at least two candidate signals listed, each tagged with where it would come from. You have circled one or two per goal. Any signal tagged "needs a new event" has a named person you will ask, and a date.
Step 5 · Turn each signal into a metric with a definition
A signal becomes a metric when it has a formula, a time window and a clear denominator. Write each one so that two analysts would calculate the same number from it.
Larkfield metrics:
- Booking completion rate: sessions that reach Booked, divided by sessions that reach Choose a service, per week. Exclude staff test accounts.
- Median time to book: median minutes from first Choose a service view to Booked, for completed sessions, per week. Use the median, not the mean, because a few people who leave the app open for an hour will drag the mean upwards.
- Details error rate: share of Your details submissions that show at least one validation error, per week.
- App booking share: appointments booked through the app, divided by all appointments booked, per week, from the clinic's booking system.
- Confidence score: share of people answering 4 or 5 to "How sure are you that your appointment is booked correctly?" on a 1 to 5 scale on the Booked screen, with the response count shown next to it.
Three habits make these hold up:
- Prefer rates to totals. "312 bookings this week" rises if the clinic gets busier. A completion rate only rises if the flow gets better.
- Show the denominator. A confidence score from 14 answers is not the same as one from 400. Always print the count.
- Plan one split. Decide in advance the one segment you will break each metric down by, for example new versus returning patients, or phone versus tablet. Deciding afterwards invites hunting for a split that looks good.
Check it worked
Each metric in your notes has a name, a formula with a numerator and a denominator, a time window, and any exclusions. Hand one definition to a colleague and ask them how they would calculate it. If their answer differs from yours, tighten the wording.
Step 6 · Add a guardrail and set baselines
A metric you push on will move, sometimes for the wrong reason. A guardrail is a number you watch, not to improve, but to catch harm caused by improving the others.
For Larkfield, the obvious risk is that making booking faster leads people to book slots they cannot make. So add no-show rate for app bookings (appointments booked in the app where the patient did not attend, divided by all app bookings, per month) as a guardrail. If completion rate rises and no-shows rise with it, the flow is not better. The reminder sent after Booked exists partly to hold this number down, so it measures that too.
Next, set a baseline for every metric: the value before you change anything.
- For a metric you can measure today, take the last four weeks.
- For a new feature, use the first two full weeks after launch as the baseline and do not judge it during those weeks.
- For adoption, the "before" value is known: before the app, app booking share was zero. Use the phone-call count as the useful baseline instead.
Only write a target where you have a reason for the number, such as a business case ("reception can handle the remaining calls if app share reaches 60%"). Leave the target blank rather than invent one.
Check it worked
Your notes contain one guardrail metric with a written reason that names the specific harm it would catch. Every metric has a baseline value, or a dated note saying when the baseline will be measured. Any target has a sentence saying where the number came from.
Step 7 · Cut it down to one table the team will track
Put everything into a single spreadsheet tab with these columns: Category, Goal, Metric, Definition, Source, Baseline, Target, Owner, Review. One row per metric. Add the dropped and deferred categories at the bottom with their reasons, greyed out.
For Larkfield the finished table has four working rows and one guardrail:
- Task success, booking completion rate: product analytics; baseline from the first two weeks after launch; owner the product designer; reviewed weekly.
- Task success, details error rate: new event on Your details; baseline from the first two weeks after launch; owner the engineering lead; reviewed weekly.
- Adoption, app booking share: clinic booking system; baseline 0%, with phone bookings at 41 calls a day; owner the product manager; reviewed weekly.
- Happiness, confidence score with response count: question on Booked; baseline from the first two weeks after launch; owner the product designer; reviewed monthly.
- Guardrail, no-show rate for app bookings: clinic booking system; baseline 9% across all bookings last quarter; owner clinic operations; reviewed monthly.
Median time to book was useful while writing definitions but did not make the cut: completion rate and error rate already cover whether people get through, and five rows is about as many as a weekly meeting will look at. Move it to a "watch if needed" list rather than deleting it.
Before you share the table, read across each row and ask: "If this moved by a lot next week, what would we do?" If the answer is "nothing", the row is decoration. Remove it.
Check it worked
Your spreadsheet has no more than six working rows, each with a source, a baseline or baseline date, a named owner and a review rhythm. Dropped and deferred categories sit below with their reasons. For every row you can say in one sentence what the team would do if it moved sharply.
Next steps
Metrics tell you that something changed, not why. When the completion rate dips, Use analytics to decide what to research shows how to turn the drop into a research question. For a standard happiness measure you can compare across releases, see Score usability with the System Usability Scale. If your happiness signal is a survey, Read survey results without fooling yourself covers how small response counts limit what you can claim. To see the reasons behind a poor task success rate, watch people use the flow in Run a five-person usability test.
Part of these paths
Related tutorials
- Use analytics to decide what to research nextYou will turn a booking flow's funnel and event data into two or three research questions, each tied to a specific number, a specific group of people and a method that can answer it.
- Score a design with the System Usability ScaleYou will have SUS scores for two versions of a design, worked out by hand and in a spreadsheet, with confidence intervals and a written statement of what the numbers do and do not show.
Need this done for you?
Padding does this work for growing companies, from the first diagnosis to a system that keeps working.
Get new tutorials