UX and research · Intermediate · 15 min
Read survey results without fooling yourself
By Padding · Updated 18 Nov 2026
Any spreadsheet (Google Sheets, Excel or LibreOffice Calc) and your survey export · November 2026
You will check who answered your survey, put a margin of error on each headline number, decide which group differences are too small to report, and write a results summary that states its own limits.
On this page
A survey result arrives as a clean number: 62% of users want a feature. The number looks solid because it has a percent sign. Behind it sit questions nobody asked out loud. Who got the survey? Who bothered to answer? How many people is 62% of? Would the number move by two points or by twenty if you ran it again next week?
Product teams rarely have the thousands of responses that polling firms work with. More often there are 40, 150 or 300 answers from a self-selected slice of users. That is still useful evidence, as long as you read it at the right resolution. This tutorial walks through the checks that stop a small survey from being reported as a big one, and ends with a summary that says plainly what the numbers can and cannot carry.
The worked example uses a fictional shift-planning app with 2,400 active accounts. The team emailed every account a short survey about a proposed calendar export. The numbers are made up but realistic; replace them with your own as you go.
Step 1 · Trace the path from invited to answered
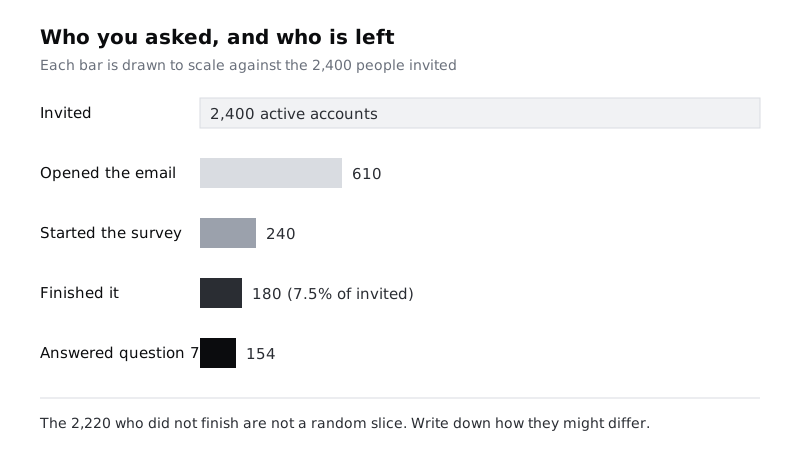
Before looking at any answer, count people at each stage. Add a small table at the top of a new sheet called "Sample":
- Invited: everyone who could have seen the survey (2,400 accounts emailed).
- Opened or saw it: if your email or in-app tool reports it (610).
- Started: answered at least one question (240).
- Finished: reached the end (180).
- Answered the question you care about: the real base for that question (154 for question 7, which was optional).
Divide finished by invited to get the response rate: 180 / 2,400 = 7.5%. Then write one line under the table answering a harder question: how might the 2,220 people who did not finish differ from the 180 who did? In the example, people who opened a survey about calendar exports probably care about calendars more than average. People on a busy shift had less time to answer. Neither is a reason to throw the data away; both are reasons to say "of those who answered" every time you quote a number.
Check it worked
Your "Sample" sheet shows five counts in falling order, a response rate as a percentage, and at least one written sentence naming a way non-responders might differ from responders. If any count is missing because your tool does not report it, the row says "not known" rather than being deleted.
Step 2 · Compare who answered with who uses the product
A survey can have a fine response rate and still speak for the wrong people. Pick one or two traits you know for your whole user base, such as role, plan, country or how long they have been a customer. Put them side by side in a small table with three columns: group, share of user base, share of finished responses. In the example:
- Managers: 25% of the user base, 67% of finished responses (120 of 180).
- Staff: 75% of the user base, 33% of finished responses (60 of 180).
Managers make up a quarter of accounts but two thirds of the answers. Any overall figure is therefore mostly a manager figure. A rough sense check is to reweight: work out the result for each group, then combine them using the user-base shares instead of the response shares. In the example, 67% of managers and 53% of staff said they would use the export. Weighted to the real mix, that is 0.25 × 67 + 0.75 × 53, about 57%, not the raw 62%.
Treat the reweighted number as a warning light, not a corrected answer. It only fixes the trait you weighted on, and the staff who answered may still be unlike the staff who did not.
Check it worked
Your sheet has a comparison table for at least one trait, with both columns filled in. Next to the headline figure you have written either "respondent mix matches the user base on <trait>" or the reweighted figure and the size of the gap between them.
Step 3 · Report counts next to every percentage
Percentages hide their base. "50%" could be 2 of 4 or 600 of 1,200. For each question you plan to report, add three columns: the number who chose the answer, the number who answered the question at all, and the percentage. Use the question's own base, not the total number of respondents. If 154 people answered question 7 (an optional question about exporting rotas today) and 96 chose "every week", the figure is 96 of 154 (62%), not 96 of 180 (53%).
Two habits make this stick:
- Write results as "96 of 154 (62%)" in drafts. You can shorten later, but you will notice when a base is small.
- When a base drops under about 30, lead with the count and drop the percentage: "11 of 19 staff on night shifts" reads honestly; "58% of night-shift staff" sounds like a finding about a whole population.
Check it worked
Every row in your results sheet has a count, a base and a percentage, and every base is the number who answered that question. Search your draft summary for "%": each one sits next to a count, and none of them rests on fewer than about 30 people.
Step 4 · Put a margin of error on each headline number
A margin of error tells you how far a percentage could plausibly move if you surveyed another sample of the same size from the same people. At 95% confidence, for a proportion p (as a decimal) from n answers, it is:
margin = 1.96 × √( p × (1 − p) / n )In a spreadsheet, with the proportion in B2 and the base in C2, put this in D2 and format it as a percentage:
=1.96*SQRT(B2*(1-B2)/C2)For a quick estimate without a spreadsheet, the margin is at most about 1 / √n. That gives a feel for small samples:
- 25 answers: up to about ±20 points
- 50 answers: up to about ±14 points
- 100 answers: up to about ±10 points
- 200 answers: up to about ±7 points
- 400 answers: up to about ±5 points
In the example, 112 of 180 said yes overall (62%). The margin is about ±7 points, so the honest statement is "somewhere around 55% to 69% of those who answered". Two cautions belong in your notes. First, the formula assumes a random sample; it measures luck, not bias, so the skews from the first two steps come on top of it. Second, it gets unreliable near 0% or 100% and with very small bases, which is another reason to lead with counts below about 30.
Check it worked
Your results sheet has a margin column filled in for every headline figure. Pick one row and check it by hand against the 1 / √n list: the spreadsheet value should be the same or a little smaller, never larger.
Step 5 · Decide whether a group difference is real enough to report
Splitting results by group is where small surveys mislead most. Managers said yes at 67% (80 of 120, ±8). Staff said yes at 53% (32 of 60, ±13). A 14-point gap looks like a story.
To test it, combine the two margins into a margin for the difference: the square root of the sum of their squares. Here that is √(8.4² + 12.6²), about 15 points. The observed gap is about 13 points, which is inside that margin, so the data cannot tell the two groups apart. Write "managers and staff answered similarly; the sample is too small to separate them", not "managers want this more".
In a spreadsheet, with the two margins in D2 and D3:
=SQRT(D2^2+D3^2)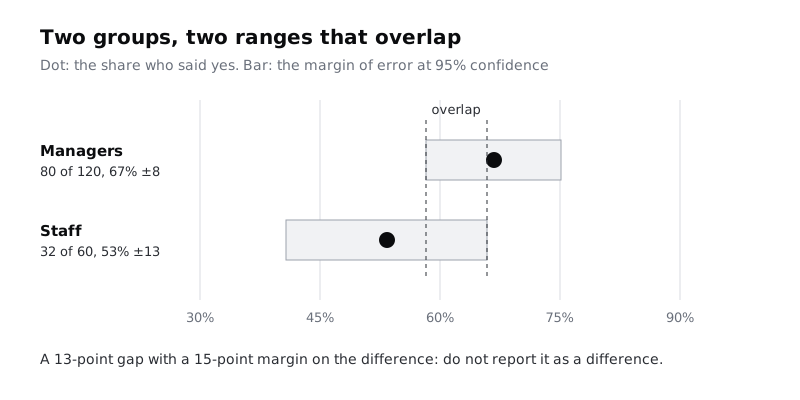
Watch for one more trap. If you cut the data ten ways (role, plan, country, device, tenure and so on), one cut will usually show a large gap by chance. Decide before you look which one or two splits matter for the decision, and treat any other striking gap as a question for the next round of research rather than a result.
Check it worked
For each group comparison in your draft, your sheet shows both groups' counts, both margins, the margin for the difference and the observed gap. Every comparison where the gap is smaller than the margin for the difference is either removed from the summary or reworded as "no clear difference".
Step 6 · Read rating scales and open answers at the right grain
Averages of rating scales hide shape. A mean of 3.0 on a 1 to 5 scale can be everyone answering 3, or half answering 1 and half answering 5, which call for very different designs. For each scale question, chart or list the count for every point on the scale, then report the share in the top two boxes (4 or 5) and the bottom two (1 or 2) with their counts and margins, as in the earlier steps.
Open-text answers need the same honesty. Tag each comment with one or more themes in a column beside it, then count comments per theme. Report those counts against the number of people who wrote a comment, and say how many that was: "Of 63 people who left a comment, 21 mentioned double bookings." Do not turn that into "a third of users worry about double bookings"; most respondents never wrote anything, and those who did chose to.
Check it worked
Each scale question in your sheet has a full distribution, not only an average. Your theme table shows a count per theme and the number of people who commented, and no theme count is described as a share of all respondents.
Step 7 · Write a summary that states its own limits
Bring it together in a one-page summary for your team. Use this structure and keep every section short:
- What we asked and who answered. Invited, finished, response rate, and the respondent mix compared with the user base.
- Headline results. Three to five findings, each as "count of base (percentage, ±margin)".
- Differences we can and cannot see. The group comparisons you planned, with which ones cleared the margin and which did not.
- Limits. Who is missing or over-represented, which questions had small bases, and that the margins cover chance only, not bias.
- What this supports. The decision the data can inform, and what it would take (more responses, interviews, product analytics) to settle the rest.
For the example, section 2 might read: "112 of 180 respondents (62%, ±7) said they would use a calendar export. Respondents were two thirds managers against a quarter of accounts; weighted to the real mix the figure is about 57%." Section 5 might say: "Enough to justify a small prototype. Not enough to say staff want it less than managers; interview six staff before deciding on defaults."
Check it worked
Your summary has all five sections. Every percentage in it has a count and base beside it, every headline figure has a margin, and the limits section names at least one group that is over- or under-represented. Ask a colleague to read only the summary and tell you how confident they would be in the headline result; if their answer matches the limits you wrote, the summary is doing its job.
Next steps
- Make the next survey easier to read by designing it for completion and clear bases: Design a short survey people finish.
- Check survey findings against what people actually do: Combine interview and analytics findings.
- Plan the follow-up research your limits section points to: Write a one-page research plan.
- Reach the people your survey missed: Recruit participants for user research.
Part of these paths
Related tutorials
- Design a short survey people will finishYou will have a survey that takes under five minutes, built from a short list of questions that each feed a decision, piloted with three people, sent, and reported with an honest completion rate.
- Combine interview and analytics findings into one storyYou will have one finding that rests on both interviews and product data, with a confidence level, the reason for any disagreement between the two, and a note on what evidence would change it.
Need this done for you?
Padding does this work for growing companies, from the first diagnosis to a system that keeps working.
Get new tutorials