UI and visual design · Intermediate · 17 min
Design a data table people can scan
By Padding · Updated 18 Nov 2026
Figma (web) · November 2026
You will have a desktop appointment table for Larkfield Clinic's reception staff, with columns ordered by task, aligned numbers, two row densities, sortable headers, row actions and a selected state, plus a written spec for every column.
On this page
Patient-facing screens show one appointment at a time. The people behind the desk see all of them at once. At Larkfield Clinic, the fictional community clinic whose booking app runs from Home to Booked, the reception team keeps one screen open all morning: today's appointments, in a table. They glance at it between phone calls, look up a patient who has just walked in, mark them as arrived, and check who has been waiting too long. Nobody reads the table from top to bottom. They scan it, and a table that is hard to scan costs a few seconds on every glance, all day.
In this tutorial you design that table for a desktop screen. Each decision is small: which column comes first, which edge a number sits against, how tall a row is, whether rows get stripes. Together they decide whether a receptionist finds "Sam Patel, 10:30" in one look or three. You end with a table frame in Figma and a column spec a developer can build from.
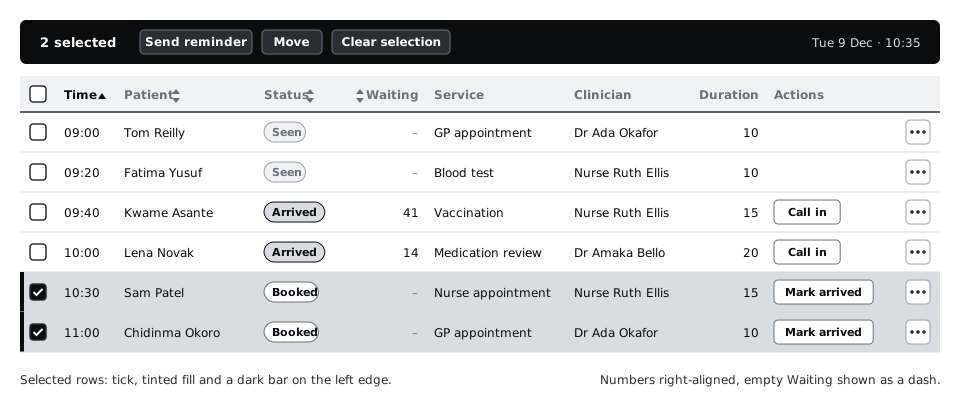
The example is Tuesday 9 December at 10:35. The booking from the patient flow, a Nurse appointment at 10:30, belongs to Sam Patel, who has not arrived yet. Around it are the morning's other appointments across Larkfield's five services: GP appointment, Nurse appointment, Blood test, Vaccination and Medication review.
Step 1 · Write down the tasks, then order the columns
Do not start from the database. An appointment record has twenty or more fields, and a table that shows them in storage order puts an internal ID first and the thing people look for somewhere in the middle. Start with what the staff do.
Make a page called Staff table and add a text note on the canvas listing the reception team's tasks, with the columns each task needs:
- A patient walks in: find them by name or time, and confirm their date of birth. Needs Time, Patient, Date of birth.
- Mark them as arrived. Needs Status and an action.
- See who has waited too long. Needs Waiting (minutes since they arrived).
- Answer "which room?" and "who am I seeing?". Needs Service, Clinician, Room.
- Plan the next hour. Needs Duration.
Then order the columns by that list, with a checkbox first for selecting rows:
Select · Time · Patient · Date of birth · Status · Waiting · Service · Clinician · Room · Duration · Actions
The first three data columns identify the row. People read a row from the left, so the column they search by goes first. The clinic runs in time order, so Time leads and the table is sorted by it. Status comes straight after the identity columns because "is this person here yet" is the question asked most often. Duration is the last data column because it matters only when planning. Actions sit at the far right and the checkbox at the far left, where staff who use other admin tools will look for them.
Some columns are deliberately missing: address, phone number and booking reference. Reception opens a row to see them. Every column you add makes every other column narrower and slower to read.
Check it worked
Your canvas note lists five tasks, and each of the nine data columns traces back to at least one of them. If you cannot name the task a column serves, move it to the row's detail view instead.
Step 2 · Set the frame, the widths and the alignment of each column
Make a frame 1366 by 768. That is still one of the most common laptop screen sizes, including on the lower-cost laptops many clinic and office front desks run, in Africa and elsewhere. If the table works at 1366, it works on larger screens too. Give the frame 24 pixels of padding on each side and a toolbar strip 56 tall at the top for the date and a density switch you add later.
Build the header row as a horizontal auto layout frame and give each cell a fixed width. Start with these, which add up to 1264 and fit inside the 1318 left between the side padding:
- Select: 48
- Time: 72
- Patient: 208
- Date of birth: 120
- Status: 128
- Waiting: 88
- Service: 160
- Clinician: 144
- Room: 72
- Duration: 88
- Actions: 136
Patient gets the most width because names vary most in length. Long names are normal, not an edge case: one morning's list can hold Chidinma Eze-Williams, Nguyen Thi Lan and Tom Reilly. Test the width with the longest name your clinic actually sees, not with a short placeholder.
Now set the alignment, one rule per kind of content:
- Text (Patient, Service, Clinician, Status): left-aligned.
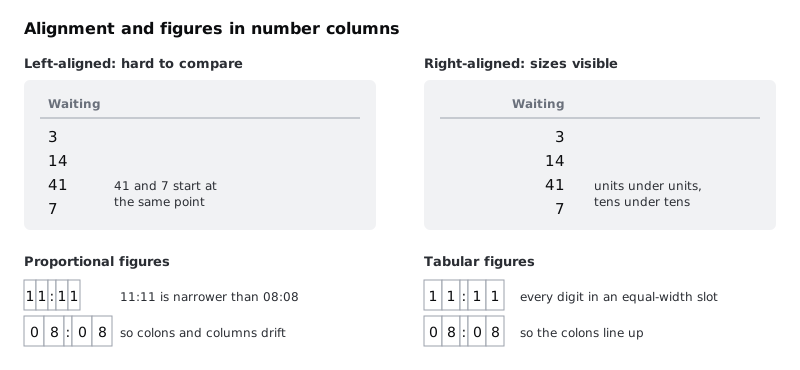
- Quantities people compare (Waiting, Duration): right-aligned, so units sit under units and tens under tens, and 41 looks bigger than 7 before anyone reads it.
- Fixed-format values (Time, Date of birth, Room): left-aligned. Every time has the same shape,
09:00to16:40, so it lines up either way, and left keeps it next to the Patient name it helps identify.
Each header label takes the same alignment as its column. A right-aligned number under a left-aligned label leaves a gap, and the eye has to jump to connect them.
Check it worked
Your header row is 1264 wide with eleven fixed-width cells. Select the Waiting and Duration header cells: their text is right-aligned, and every other header is left-aligned. Type Chidinma Eze-Williams into a Patient cell: it fits on one line without running into the Date of birth column.
Step 3 · Use tabular figures for every number
Most interface fonts draw digits at different widths by default, so a 1 is narrower than an 8. In a sentence that looks better. In a column it means 11:11 is narrower than 08:08, right-aligned numbers wobble, and times stop lining up under each other.
Tabular figures give every digit the same width. In Figma, select a text layer, open the type details from the Typography section of the right sidebar, and choose tabular in the number options. The option appears only when the font supports it. Inter, which Larkfield uses, does.
Apply it to every cell that holds digits: Time, Date of birth, Waiting, Duration and Room. The dependable way is a dedicated text style, Table/Number, with the Body/Small settings (Inter Regular, 14, line height 20) plus tabular figures, so nobody has to remember the setting cell by cell. Use plain Body/Small for the text cells and Label (Inter Semi Bold, 14) for the header.
Write in the spec that the developer sets font-variant-numeric: tabular-nums on these cells. The setting does not travel from Figma to code by itself.
Check it worked
Type 11:11 in one Time cell and 08:08 in the cell below. With tabular figures on, the colons sit exactly above each other. Turn the setting off on one cell to see the difference, then turn it back on.
Step 4 · Choose the row height and offer two densities
Row height trades how many rows fit on screen against how easy it is to follow one row across. Larkfield's table is wide, so following a row from Patient to Room is the harder job. Make the default row 48 tall: 14 pixels of padding above and below a 20-pixel line of text.
Some staff want more rows in view, for example during the busy first hour when they watch for arrivals. Offer a compact density at 36 tall, with 8 pixels of padding above and below. Change only the vertical padding, never the font size: small text slows reading more than a shorter row speeds it up.
Build the row as a component with a Density property, Default and Compact. Then check the controls still fit. In compact rows the action button is 28 tall and the More button 28 by 28, both above the 24 by 24 minimum target size in WCAG 2.2, and the checkbox gets a 24 by 24 hit area even though its box is drawn at 16.
Do the arithmetic and write it in your spec, because it is the reason the option exists. The 768 frame minus the 56 toolbar and a 48 header leaves 664 pixels: 13 default rows or 18 compact ones. In a real browser on a 1366 by 768 laptop, the address bar and the system taskbar take another 100 pixels or more, so expect about 11 and 15.
Add the switch to the toolbar as a two-option segmented control labelled Default and Compact, so staff can find it and change it back.
Check it worked
Your row component has two Density variants. Stack 13 default rows under the header: the last one ends at or above the bottom of the 768 frame. Swap them all to compact: there is room for five more, and no text, checkbox or button is clipped.
Step 5 · Separate rows with lines, not stripes
There are two common ways to help the eye follow a row: zebra stripes (every other row tinted) and a thin divider under each row. Try both on a copy of the table before you choose.
For this table, use dividers. Put a 1-pixel colour/line (#D5D9DF) stroke along the bottom of each row and keep row fills colour/surface (#FFFFFF). Stripes lose at Larkfield because the table already uses tint for two other jobs, the selected row and the hover state. Stripes add a third band, and a receptionist glancing quickly can no longer tell "selected" from "every second row". Stripes also move when rows are sorted or filtered, so the tint lands on different patients each time.
Stripes earn their place in a different kind of table: read-only and very wide, with no selection, such as a monthly report. Use them there if you like.
Add a hover variant to the row component with the fill colour/canvas (#F6F7F8), so the row under the pointer stands out while someone reads across it. Row dividers are decorative and do not need 3:1 contrast. Text does: the muted text you use for empty values must pass on the hover fill too. In the Larkfield palette text-muted on canvas is 5.73:1, above the 4.5:1 that WCAG asks for.
Check it worked
Put the striped copy and the lined copy side by side and select one row in each. In the lined copy, the selected row is the only tinted band in its part of the table. Put a finger on Sam Patel's name on your screen and trace right to the Room cell without lifting it: you land on Room 3, not the row above or below.
Step 6 · Make sortable headers look sortable
Staff will sort by Time (the default), Patient, Status and Waiting. Sorting by Date of birth, Room, Duration or Actions helps nobody, so those headers stay plain. A header that looks clickable and does nothing is worse than one that never looks clickable.
Make a Header cell component with these variants:
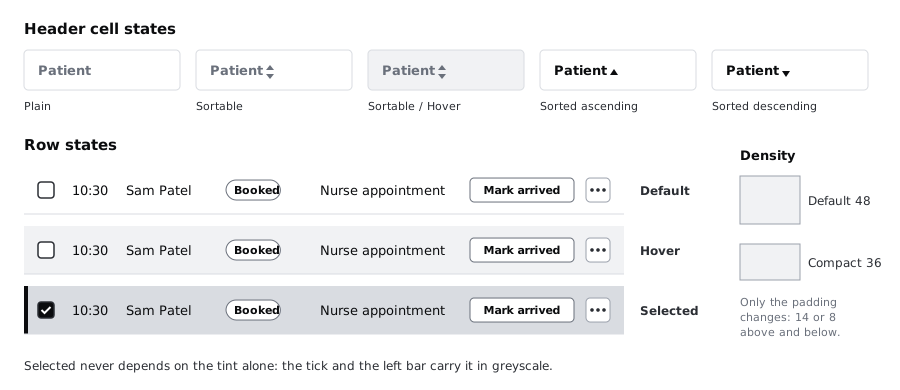
Plain: label only, inLabelandcolour/text-muted.Sortable: the same label plus a small two-way sort icon incolour/text-muted, always visible, so people can see which columns sort without hovering.Sortable / Hover: the same, on acolour/canvasfill.Sorted ascendingandSorted descending: the label turnscolour/text, and the icon becomes a single arrow pointing up or down incolour/text.
Only one header is ever in a sorted state. Put the icon after the label in left-aligned columns and before the label in right-aligned ones (Waiting), so the label still lines up with its values.
Write the sort behaviour into the spec. The first click sorts ascending and the second descending, except Waiting, which sorts descending first because the question is "who has waited longest". Status sorts in the order of the day (Booked, Arrived, With clinician, Seen, Did not attend), not alphabetically. The developer marks the sorted header with aria-sort so screen reader users hear the current order.
Check it worked
Your header row shows Time as Sorted ascending, Patient, Status and Waiting as Sortable with the icon visible, and the other seven cells as Plain. Squint at the header: the sorted column stands out before you read the arrow, because its label is the only dark one.
Step 7 · Add row actions and a selected state
Each row needs one obvious next action, and it depends on the status:
Booked: a secondary button,Mark arrived.Arrived:Call in, which tells the clinician the patient is ready.With clinician,Seen,Did not attend: no button; the cell is empty.
Less common actions go in a More menu at the end of the row: Move appointment, Mark as did not attend, Cancel appointment. Draw it as a 28 by 28 icon button and write its accessible name in the spec, for example More actions for Sam Patel. Keep the button and the More menu visible at all times. Actions that appear only on hover cannot be found on a touch screen and are easy to miss from the keyboard.
Status is text first. Put the word in a small badge (Arrived, Seen) and use colour as a second signal only: accent text on accent-tint for Arrived, notice text on notice-tint for Did not attend, plain text-muted for Seen. Every badge makes sense in greyscale because it says what it means. Give each badge a 1-pixel stroke in its text colour as well, so it keeps its edge when it sits on a tinted row.
Now the selected state. Staff select rows to send reminders or move several appointments at once. A selected row gets three signals, so it is clear without colour:
- the checkbox is ticked
- the row fill changes to
colour/accent-tint(#E3F0EE) - a 4-pixel
colour/accentbar appears on the row's left edge
When one or more rows are selected, the toolbar turns into a bulk action bar: 2 selected, then Send reminder, Move and Clear selection. Draw that as a second toolbar variant. Reminders matter at Larkfield because many patients book on one phone and read texts later, when they have data or signal, so a reminder sent an hour early is more use than one sent ten minutes before.
Check it worked
Fill the table with the morning's rows, including Sam Patel at 10:30, Nurse appointment, Booked, Waiting empty, with a Mark arrived button. Select his row and Chidinma Okoro's at 11:00: the toolbar reads 2 selected. Then desaturate the frame (a greyscale layer on top, or your operating system's greyscale filter): you can still pick out both selected rows by the tick and the left bar, and every status by its word.
Step 8 · Write the column spec
The frame shows one moment. A developer also needs the rules: what each column shows when the data is long, missing or odd. Put a spec table on the canvas beside the frame, one row per column, with these headings:
- Column and Source field
- Format, for example
HH:MM, 24-hour, tabular figuresorWhole minutes since arrival - Width and Alignment
- Sortable and First sort direction
- Long values: Patient wraps to two lines, because staff identify people by name and a cut-off name can match the wrong person; Service and Clinician truncate with an ellipsis and show in full in the row's detail view
- Empty value: Waiting shows an en dash
–intext-mutedwhen the patient has not arrived, never0, which would mean they arrived this minute
Under it, add four table-wide rules: the default sort (Time ascending), the two densities and their heights, the row states (default, hover, selected), and the bulk action bar. Note that the table is built with real table markup and header cells, so screen reader users can move by row and column. Build a responsive HTML table is the code side of this spec.
Check it worked
Your spec has eleven rows, one per column in the frame, in the same order. Every row has an entry under Long values and Empty value, even when the entry is "cannot happen". Ask someone who has not seen the design to read the Waiting row and tell you what a patient who has not arrived shows: they answer "a dash", not "zero".
Next steps
You now have a desktop staff table, its components and a column spec. The same table has to work in other places:
- Make a data table work on a phone takes this table to a 360-pixel screen and compares four patterns for doing it.
- Build a responsive HTML table builds it in code with a caption, header cells, tabular numbers and a sticky header.
- Never rely on colour alone to carry meaning goes further into the status badges and selected state.
- Create visual hierarchy with size, weight and position helps you decide what the toolbar above the table should emphasise.
Part of these paths
Related tutorials
- Make a data table work on a phoneYou will have tried four phone patterns on the same Larkfield appointment table, matched each one to the task it suits, and finished a 360 px frame for the pattern you chose, with a short note on when the other three would win.
- Build a responsive HTML tableYou will build the Larkfield Clinic staff appointment table with real table markup, tabular numbers, a sticky header and a sticky first column inside a labelled, keyboard-focusable scroll area, so it keeps its table semantics from a desktop monitor down to a 360 pixel phone.
- Create visual hierarchy with size, weight and positionYou will have a strip of six Figma frames that takes a flat confirmation screen to a clear one, one lever at a time, and a squint test showing the primary action is the strongest shape on the screen.
Need this done for you?
Padding does this work for growing companies, from the first diagnosis to a system that keeps working.
Get new tutorials