UI and visual design · Beginner · 15 min
Never rely on colour alone to carry meaning
By Padding · Updated 18 Nov 2026
Figma (web) and Chrome or Firefox DevTools · November 2026
You will have a booking screen, an error state and a small bar chart that still read correctly in greyscale and under four colour-vision simulations, because every meaning that colour carries now has a second cue.
On this page
Colour is a fast signal, and a fragile one. A teal fill on a time slot tells most people "this one is chosen", until the person looking has a colour vision deficiency, is reading a cheap phone screen in bright sunlight, has switched their phone to a greyscale mode to save battery, or prints the page on a black and white printer. Then the teal slot is one more grey box, and the patient books the wrong time without knowing it.
The rule that guards against this is WCAG 2.2 success criterion 1.4.1, Use of Color: colour must not be the only visual way to tell people something, ask them to act, or set one element apart from another. It does not ban colour. It asks that colour always has a partner: a word, an icon, a shape, a weight, a border or a position that carries the same meaning on its own.
This tutorial is about that redundancy, not about contrast ratios, which Meet contrast rules for text, icons and focus rings covers. You take two Larkfield Clinic booking screens and a small chart from the clinic's staff dashboard, run them through colour-vision simulation in your browser, list every place where colour works alone, and add a second cue to each.
Step 1 · Build the test set
You need three things to test, side by side on one Figma page. Add a page called Colour alone to your Larkfield file and duplicate these frames onto it:
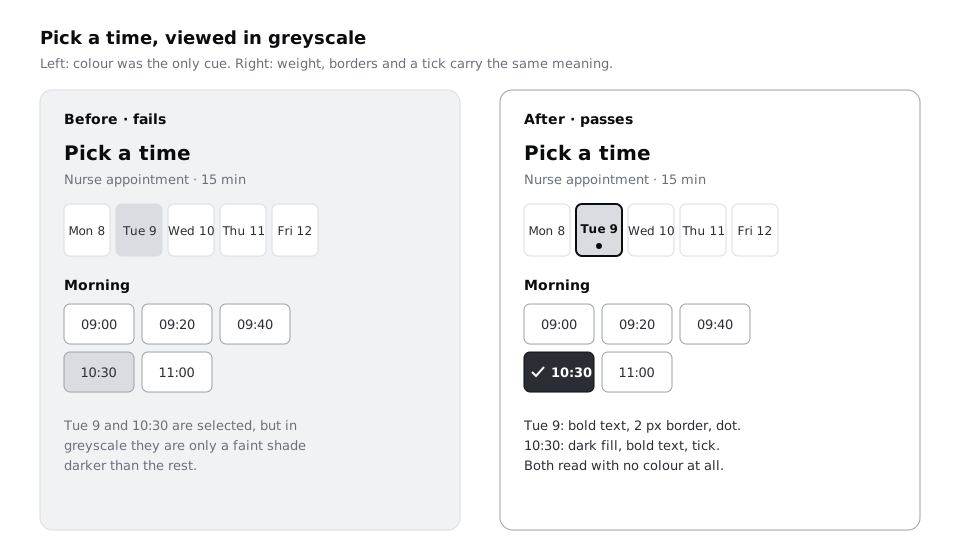
Pick a time, withTue 9selected in the week strip and10:30selected among the Morning slots.Your details / Errors, with the mobile number field in its error state.- A chart frame, 390 by 300, which you draw now.
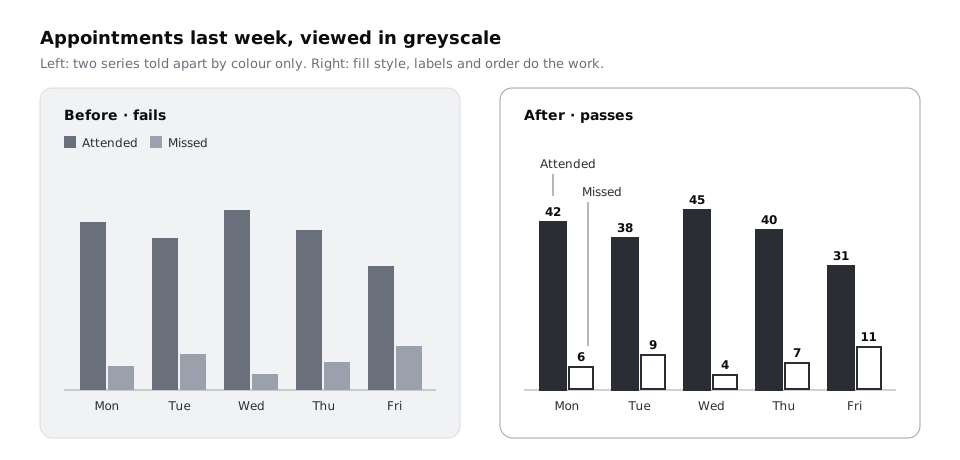
The chart is a small one from the clinic's staff dashboard: appointments last week, attended and missed, Monday to Friday. Draw it with plain rectangles, two bars per day, using these numbers:
- Mon: 42 attended, 6 missed
- Tue: 38 attended, 9 missed
- Wed: 45 attended, 4 missed
- Thu: 40 attended, 7 missed
- Fri: 31 attended, 11 missed
Colour the attended bars green (#2E8B57) and the missed bars red (#C0392B), and put a legend of two coloured squares above the chart. This is the way many dashboards are drawn, and it is exactly the case you are here to test. Leave out value labels for now.
If you do not have the Larkfield screens, use any screen with a selected item and a form error. The steps work the same way.
Select the three frames and export them as PNG at 2x into a folder called colour-alone-test. Name them pick-a-time.png, details-errors.png and chart.png.
Check it worked
Your colour-alone-test folder holds three PNG files. Open chart.png: you see ten bars in two colours, a two-item legend and no numbers on the bars. Open pick-a-time.png: Tue 9 and 10:30 are selected exactly as they are in your design file.
Step 2 · Run the four simulations in your browser
Drag pick-a-time.png into a new browser tab so the image fills the page. Browsers can simulate how a page looks with a colour vision deficiency, and the simulation applies to everything on the page, including an image of your design.
In Chrome or Edge, open DevTools (F12, or Cmd+Option+I on a Mac), open the Command Menu with Cmd+Shift+P or Ctrl+Shift+P, type Rendering and choose Show Rendering. Scroll the Rendering tab to Emulate vision deficiencies and pick, one at a time:
- Protanopia, no red-sensitive cones, so red light is not perceived
- Deuteranopia, no green-sensitive cones, so green light is not perceived; red-green deficiencies like this one and Protanopia are the most common
- Tritanopia, no blue-sensitive cones, so blue light is not perceived
- Achromatopsia, no colour at all: a greyscale view
In Firefox, open the Accessibility tab in DevTools and use its Simulate menu, which offers the same four plus Contrast loss.
Look at each simulation for about ten seconds and ask one question: can I still tell what is selected, what is wrong and which bar is which? Then do the same for the other two PNGs. Keep the DevTools panel open; the emulation stays on while you switch between images in the same tab, but resets if you open a new tab.
The simulations are models, not a substitute for testing with people who have these conditions, and they only show colour. Around 8% of men and 0.5% of women have some form of colour vision deficiency, and far more people meet the same problem from glare, a dim screen or a greyscale mode. Achromatopsia is the strictest of the four: if a screen reads in greyscale, it usually reads under the other three as well.
If you would rather stay in Figma, the Figma Community has colour-vision simulation plugins. Check what a plugin can read in a client file before you run it, and compare its output with the browser once to be sure they agree.
Check it worked
You have viewed each of the three images under all four simulations, twelve views in all. Under Deuteranopia, look at chart.png: if the green and red bars turn into two similar olive or brown shades, you have seen the problem this tutorial fixes.
Step 3 · Log every place colour works alone
Now write down what you saw, before fixing anything. Next to the frames, add a text layer or a small table with four columns:
- Element: what it is, such as "Selected day in week strip".
- What colour means: "this day is chosen".
- Other cues today: anything else that says the same thing, or "none".
- Fails under: the simulations where you could not tell.
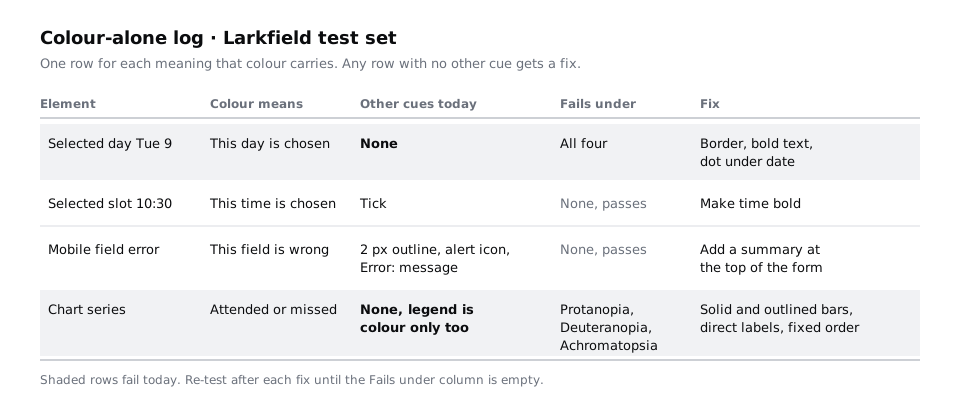
Work through each frame from top to bottom. On Larkfield, a typical log has these rows:
- Selected day
Tue 9: accent fill. Other cues: none, the text is the same weight as the other days. Fails under all four. - Selected slot
10:30: accent fill and a tick (if you followed part 4 of the design series). Other cues: tick. Passes. - Mobile field error: red outline. Other cues: 2 px outline instead of 1 px, an alert icon and an
Error:message. Passes, but check that the icon and message are really there on your copy. - Chart series: green for attended, red for missed. Other cues: none, and the legend is colour only too. Fails under Protanopia, Deuteranopia and Achromatopsia.
Also search your copy for instructions that point at colour or shape alone, such as "tap the green button" or "times in red are full". Those fail WCAG 1.3.3, Sensory Characteristics, and the fix is the same idea: name the thing, not its colour.
Check it worked
Your log has at least four rows, one for each meaning that colour carries on the three frames. Every row marked "none" in the Other cues column also has at least one simulation listed under Fails under.
Step 4 · Give the selected day and slot a second cue
Selection is the most common colour-only signal in booking flows, because a filled box looks finished to the designer who chose the fill. Fix it in the main components, not on the screen, so every instance picks it up.
For the week strip day, edit the selected version so that it differs from the others in at least two ways that are not colour:
- Weight: the day name and date in bold, the rest regular.
- Shape: a 2 px border in
colour/textaround the selected day, or a small dot under the date. - Words for screen readers: add a note on the component for developers that the selected day must be exposed as selected to screen readers, for example
aria-selected="true"if the days are options in a listbox, oraria-pressed="true"if each day is a toggle button, so the meaning also exists without sight.
For the time slot, keep the tick and make the time bold in the selected version. A tick is a widely recognised shape for "chosen" and needs no reading, but its meaning is not universal: in some countries a tick on a form can mark a wrong answer. The bold time is the cue that does not depend on the icon, so keep both.
Avoid a second cue that depends on hover or animation, such as a glow that only appears on mouse-over. Most patients book on a phone, where there is no hover.
Check it worked
Drag the updated Pick a time frame into the browser again (re-export it first) and switch on Achromatopsia. You can point at Tue 9 and 10:30 straight away and say why each one looks chosen: bold text, a border or dot, and a tick. Cover the image with your hand except for one row of slots: the chosen slot still stands out from its neighbours.
Step 5 · Make the error state say what went wrong in words
A red outline alone says "something is different here", not "this is wrong" and not "do this". Larkfield's error field from part 4 already has three cues, and this step is the place to check yours has them all:
- A thicker outline (2 px in place of 1 px), which reads as a change of shape even in greyscale.
- An alert icon at the start of the message, which is a shape that reads in any colour.
- A message that starts with
Error:and says what to do:Error: Enter a mobile number with 11 digits, such as 07700 900123.
Then look at the form as a whole. If a person submits the form with two errors, a red outline halfway down a long page is easy to miss on a small screen. Add a short message at the top of Your details / Errors, in the danger-tint banner style: There are 2 problems with your details with the alert icon, followed by the names of the two fields. People who scroll past the outline still find the problem.
Colour meanings also change with culture and context. Red can mean danger, mourning, celebration or a political party depending on where your users are, and green does not mean "go" everywhere. Patients across Nigeria, Kenya, Ghana and South Africa will read colour through their own context, and so will patients in Larkfield. Words and icons travel better than colour meaning, which is one more reason never to let status depend on colour alone.
Check it worked
Under Achromatopsia and Protanopia, the mobile field on Your details / Errors is clearly different from the fields around it: thicker outline, icon and a message beginning Error:. Read the screen aloud from the top: within the first two lines you say how many problems there are.
Step 6 · Fix the chart with outlines, labels and position
Charts are where colour-only meaning hides most, because the legend sits away from the bars and asks the reader to match colours back and forth. Make each series readable in three independent ways:
- Fill style. Keep attended as a solid fill. Change missed to an outlined bar: a white fill with a 2 px stroke in the same red. Solid against hollow reads in greyscale, on a printout and under every simulation.
- Direct labels. Write the value on or above each bar (
42,6and so on), and label the two bars on Monday with the series name,AttendedandMissed, inBody/Small. Once the series is named on the chart, you can delete the separate legend, or keep it and give it the same solid and outlined squares. - Position. Keep the order the same on every day: attended on the left, missed on the right. Position is a cue people learn after the first day.
While you are there, make the outline and fills reach 3:1 against the white chart background, which WCAG 1.4.11 asks for parts of a graphic people need to understand. Both #2E8B57 and #C0392B do on white, but any lighter tint you choose for a theme should be checked again.
A note for clinics that print reports or share them as images in a messaging group: those copies are often greyscale, compressed or viewed on a small, dim screen. Direct labels survive all three, and they cost nothing in data.
Check it worked
Re-export chart.png, open it in the browser and switch on Deuteranopia, then Achromatopsia. Without looking at the original, answer: how many patients missed an appointment on Friday? You can read 11 from the outlined bar on Friday, and you know it is the missed series because the bar is hollow and sits on the right.
Step 7 · Re-test everything and leave a rule behind
Export all three frames again and run the full set: four simulations on each of the three images. Then try two quick checks that need no tools:
- Squint test: zoom out in Figma until the text is unreadable. Selected items, the error field and the two chart series should still be distinguishable by shape and weight.
- Phone test: send the PNGs to a phone, turn the brightness down to its lowest setting and look at them by a window. A lot of patients see the app this way, especially on older Android phones with dim screens.
Update your log: every row should now list at least one cue other than colour, and nothing should be listed under Fails under. Then make the fix stick. In the description of the Time slot, week strip day and Text field components, add one line, such as "Selected: accent fill plus bold text and tick. Never colour only." The next designer who edits the component sees the rule where the change happens.
Check it worked
Your Colour alone page holds the three fixed frames and a log in which every row has a non-colour cue and an empty Fails under column. Under Achromatopsia, someone who has never seen the app can tell you which day and time are chosen, which field has an error and which bars show missed appointments.
Next steps
Redundant meaning works best when colour already has a clear job. Use colour for roles, not decoration helps you give each colour on a screen one role and remove the rest.
Contrast is the other half of colour accessibility. Meet contrast rules for text, icons and focus rings checks icons, borders and focus indicators against WCAG's ratios. If you have not built the Larkfield screens yet, start with Turn a mid-fidelity layout into a high-fidelity design.
Part of these paths
Related tutorials
- Use colour for roles, not decorationYou will have a screen that uses one accent colour and neutrals, with every colour given a job, and a colour-role legend that says what each colour is for and never for.
- Meet contrast rules for text, icons and focus ringsYou will have a contrast log for one Larkfield Clinic screen that covers icons and field borders, placeholder text, text on a photo and gradient, a disabled button and focus rings, with a measured ratio, a verdict and a fix for each failure.
- Turn a mid-fidelity layout into a high-fidelity designYou will have high-fidelity Larkfield Clinic booking screens in Figma, coloured, typeset, with icons and one photo, every text and colour pair checked for contrast and ready to wire into a prototype.
Need this done for you?
Padding does this work for growing companies, from the first diagnosis to a system that keeps working.
Get new tutorials