UI and visual design · Intermediate · 16 min
Design a dashboard people read at a glance
By Padding · Updated 18 Nov 2026
Any design tool that draws frames, such as Figma (web), and a spreadsheet · November 2026
You will have a one-screen morning dashboard for a clinic manager, built from three questions, with a number, a short chart or a list chosen for each, and a note that maps every element on it to the question it answers.
On this page
Most dashboards start as a list of everything the system can count. Someone asks for "a dashboard", a designer lays out a grid of tiles, and each tile gets a chart because charts look like dashboards. The result is a screen that is busy, colourful and slow to read, because nobody decided what it is for.
This tutorial works the other way round. You start from the few questions one person asks at one moment of their day, choose the plainest form that answers each, and say no to everything else, including charts that look useful but change nothing anyone does.
The person is the manager of Larkfield Clinic, the fictional community clinic whose booking app runs from Home to Booked. Every morning at about 08:10, before the first patient at 09:00, she opens the admin system on the reception laptop, or on her phone on the way in. The day is Tuesday 9 December. Larkfield runs five services: GP appointment, Nurse appointment, Blood test, Vaccination and Medication review. One of today's bookings is Sam Patel's Nurse appointment at 10:30, the booking from the patient flow. You end with one dashboard frame and a written note that maps each element to the question it answers.
Step 1 · Write the three questions and what changes because of each
Make a page or file called Morning dashboard and add a text note on the canvas called Questions. Before you draw anything, write the questions the manager asks at 08:10, in her words, and next to each one the thing she does differently depending on the answer. A question with no action next to it is curiosity, and curiosity belongs in a report.
For Larkfield, after a ten-minute conversation with the manager, the note reads:
- How full is today? If there are free slots, she tells the front desk which services can take walk-ins and asks them to offer slots to the waiting list.
- Who has not confirmed? Patients get a reminder text the day before and reply to confirm. She asks the front desk to call anyone who has not replied before 10:00, so a slot is not wasted if they are not coming.
- What needs attention? She sorts each one out, or hands it to someone, before the first patient at 09:00: a clinician off sick with no cover, an interpreter not booked, a reminder text that did not arrive.
Under the questions, start a second list called Parked. Every time someone asks for "and could it show..." during the project, write the request there instead of adding it to the screen. You will come back to this list in a later step.
If you cannot talk to the person, do not invent their questions. Watch what they check first thing in the morning for a week, or ask the front desk what the manager asks them at 08:15. Those are the questions.
Check it worked
Your Questions note has exactly three questions, each written as something a person would say aloud, and each with an action that starts with a verb she does (tells, asks, sorts out, hands over). If an item has no action, move it to Parked. If you have more than three, ask which ones the manager would still check if she had only one minute.
Step 2 · Collect one real morning's data before you choose a layout
Designers often fill dashboards with tidy, invented numbers: four tiles of similar length, every list exactly five rows long, nothing empty. Real mornings are lumpier. Open a spreadsheet and copy in one actual morning, or a realistic one built from the booking records, with one tab per question.
Tab Capacity: one row per service, with slots on the rota and slots booked.
- GP appointment: 24 slots, 21 booked
- Nurse appointment: 16 slots, 14 booked
- Blood test: 12 slots, 10 booked
- Vaccination: 8 slots, 4 booked
- Medication review: 4 slots, 3 booked
That is 52 of 64 slots booked, with 12 free.
Tab Not confirmed: the seven patients who have not replied to Monday's reminder, with time, name and service. They run from Grace Adjei at 09:20 (Blood test) to Peter Hughes at 15:00 (Nurse appointment), and include Sam Patel at 10:30.
Tab Attention: the three items that need someone to act.
- Dr Okafor is off from 13:00 and has no cover: 6 GP appointments are affected.
- Fatima Yusuf's Medication review at 11:20 needs a Yoruba interpreter, and none is booked.
- 2 reminder texts were not delivered: Musa Bello and Peter Hughes.
Then add the awkward cases from other days to the bottom of each tab: a morning with 19 unconfirmed patients, a morning with nothing needing attention, a patient with a long name such as Chidinma Eze-Williams. The layout has to survive all of them, not only today.
Check it worked
Your spreadsheet has three tabs, one per question, and each tab includes at least one awkward case: a long list, an empty list or a long name. Add up the Capacity tab: the booked and total columns give 52 and 64. If your numbers come out round and even, check they came from real records, not from your head.
Step 3 · Choose a number, a list or a chart for each answer
Look at what shape each answer has, and pick the plainest form that carries that shape. Three questions settle almost every case:
- Is the answer one quantity? Show a number, with enough words around it to say what it counts.
- Is the answer a set of people or things someone will act on one by one? Show a list, with the action on each row.
- Does the answer depend on comparing a few quantities with each other? Then a simple chart helps, because the eye compares lengths faster than it compares digits.
Apply them to Larkfield:
- How full is today is one quantity, 52 of 64. But the manager's action is to tell the front desk which services have room, and the total alone does not say that. So the answer is a number first, then five bars, one per service, showing booked against capacity.
- Who has not confirmed is a set of seven people, each to be called. That is a list in time order, with a Call button on each row. A chart of "7 unconfirmed" would give the count and hide the names, which are the part anyone acts on.
- What needs attention is a short set of problems, each needing a different action. That is a list too, with one action per item, and a single line, "Nothing needs attention this morning", when it is empty.
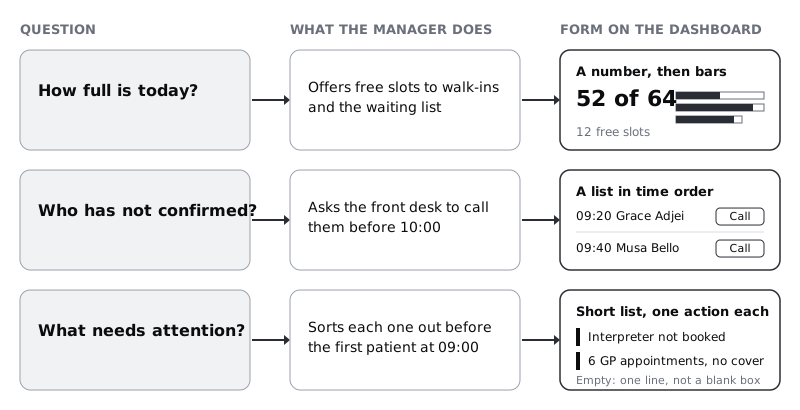
Write the choice and the reason next to each question in your Questions note. Two of the three answers are lists. That is normal: dashboards are mostly used to decide what to do next, and the things to do are usually people or tasks, not trends.
Check it worked
Each question in your note now has a form (number, list or chart) and a one-line reason that mentions the action. There is at most one chart on the whole dashboard. If you chose a chart for a question whose action is "call these people" or "fix these things", change it to a list.
Step 4 · Test every other widget against the questions
Now go back to the Parked list. By this point it usually holds requests like these, and some of them will come from senior people:
- An occupancy gauge showing 81%.
- A pie chart of bookings by service.
- A line chart of bookings over the last 12 weeks.
- A map of where patients live.
Put each one through the same two-part test: which of the three questions does it answer, and what would the manager do differently at 08:10 because of it? Write the result next to it.
- The gauge repeats the 52 of 64 that the number already shows, as a percentage, in a shape that takes up a lot of space and cannot show which service has room. Cut it.
- The pie shows how the booked slots divide between services. The manager's question is where the free slots are, which the pie leaves out, and the bars already answer it. Cut it.
- The 12-week trend answers a real question, "are we getting busier?", but nobody changes this morning's plan because of it. Move it to the monthly report.
- The map is interesting and answers none of the three questions. Cut it.
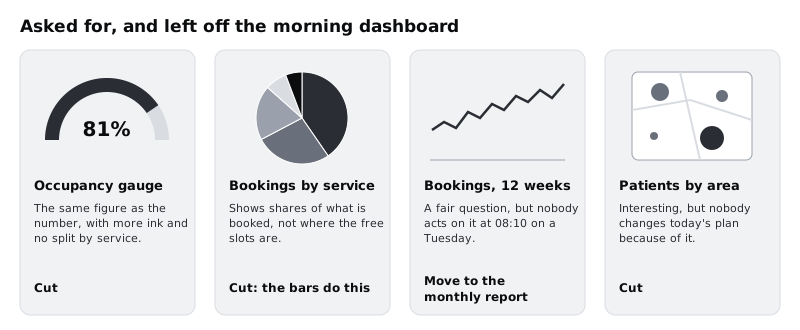
Saying no is easier with the reason written down. "It doesn't answer any of the three questions" is a design decision people can argue with and agree to. "It looked cluttered" is a taste call that invites the next request. Keep the Parked list in the file, with each verdict, so the same request is not reopened next month.
Check it worked
Every item on your Parked list has a verdict (cut, or moved to a named report) and a one-line reason that refers to the three questions. Nothing on the list has been added to the dashboard unless you could name the question it answers and the action it changes.
Step 5 · Lay out the frame in order of urgency
Make a frame 1366 by 768, the laptop screen at the reception desk. Everything must fit without scrolling: if the manager has to scroll to see whether anything needs attention, she will sometimes not scroll.
Order the three blocks by what goes wrong if she misses them, not by the order the questions were written in:
- Needs attention, across the full width at the top. These items cost the most if missed, and there are usually few of them.
- How full is today, bottom left.
- Not confirmed, bottom right, where the list has room to run down.
Put a header strip above all three with the clinic name, the date and the time the data was last updated: Tuesday 9 December · Updated 08:10. A dashboard without a timestamp invites people to trust numbers that may be an hour old.
Give each block a plain title that repeats the question, with the count in brackets where there is one: Needs attention (3), How full is today, Not confirmed (7). Titles like "Operational alerts" or "Utilisation" make the reader translate before they can read.
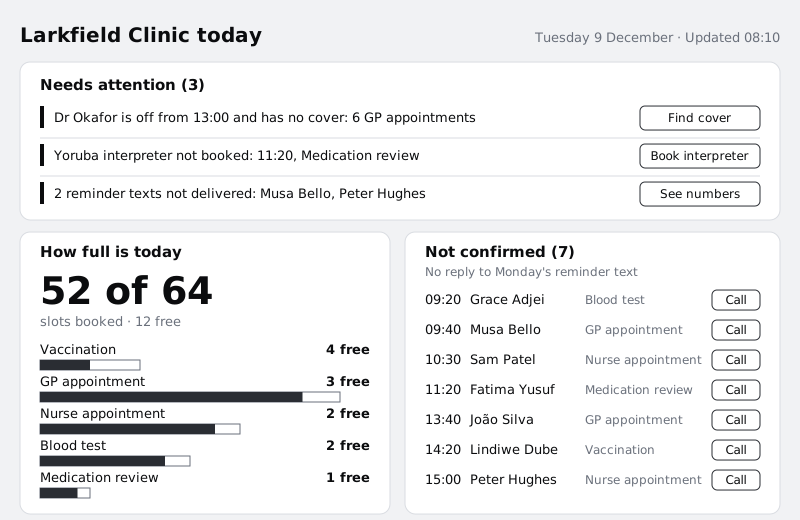
Then make a second frame, 360 by 800, for the phone. Stack the same three blocks in the same order, one column. Keep it light: text and a few rectangles load quickly on a slow or metered mobile connection, which matters to anyone checking on prepaid data on the bus, and they render quickly on an entry-level Android phone. Leave out anything that would need a large image or a live-updating chart library.
Check it worked
Your laptop frame shows all three blocks and the header within 1366 by 768, with no part cut off at the bottom. Read the block titles aloud in order: they are the three questions, with Needs attention first. In the phone frame, the same three blocks appear in the same order, and Needs attention is visible without scrolling.
Step 6 · Make the number say what it counts
A big number on its own is a puzzle: 81% of what, compared with what? Design the number block so that a person who reads only it knows what is true.
- Lead with the count people act on:
52 of 64, set larger than anything else on the screen, withslots booked · 12 freeunder it in a smaller muted style. The front desk deals in slots, so slots beat a percentage here. If you show a percentage at all, make it the small text, not the headline. - Use tabular figures for every number on the dashboard, so digits line up and do not shift width when the data updates. Note in the handoff that developers set
font-variant-numeric: tabular-nums. - Do not add a green or red arrow for "up" or "down". Up against what, and is up good? If a comparison matters, write it in words, for example
3 more than last Tuesday. Here it does not change the morning's action, so leave it out.
If you are using the Larkfield styles, this number is the one place the dashboard goes above the text scale: set it bigger than Heading/L (28), for example 48 bold, so it outranks the block titles at a glance. Set the line under it in Body/Small with colour/text-muted, which is 5.73:1 on the canvas background and well above the 4.5:1 that WCAG asks for text.
Check it worked
Cover everything except the number block and show it to a colleague. Ask "what does this tell you?" They answer in one sentence that includes slots and the 12 free, without asking what the number means. Click each number on the frame: all of them use tabular figures, and every one except the headline 52 of 64 uses one of the existing text styles.
Step 7 · Draw the one chart honestly
The five bars in How full is today are the only chart, so make them do one job well.
- Horizontal bars, one per service, labelled directly. Put the service name above its bar and the free count at the right end of the row. With direct labels there is no legend to look up.
- Draw booked inside capacity. The outline of each bar is the service's capacity on the same scale for all five, and the filled part is what is booked. A short bar (Medication review, 4 slots) and a long one (GP appointment, 24 slots) are then honest about size, and the gap at the end of each is the free space.
- Sort by free slots, most first. The manager's question is where there is room, so Vaccination (4 free) goes at the top, not GP appointment because it is biggest, and not alphabetical order.
- One colour for booked. Use
colour/accentfor the filled part andcolour/surfacewith acolour/borderoutline for the capacity. The outline matters: the empty part of the bar is information, so it needs 3:1 contrast against the card.border(#7D8592) reaches 3.72:1 on white. Aline-coloured outline (#D5D9DF) at 1.42:1 would make the free space disappear. - No 3D, no gradients, no gridlines. The free count is written next to each bar, so nobody needs to read values off an axis.
Then style the two lists. Each row shows the time first in tabular figures, the name, the service in muted text and the action button at the right end. Keep the action visible on every row, not only on hover, because the phone has no hover. When Not confirmed grows past the space (the 19-patient morning in your data), show the first eight in time order and a link Show all 19, rather than letting the block push the others off screen. When Needs attention is empty, show the line "Nothing needs attention this morning" so the manager can tell an empty list from one that failed to load.
Check it worked
Turn the frame greyscale, or put a desaturate layer over it. You can still tell booked from free in every bar, and every row in the two lists still makes sense, because nothing depends on colour alone. Paste the 19-patient list from your spreadsheet into Not confirmed: the block still fits, showing eight rows and the Show all 19 link.
Step 8 · Write the mapping note and run a five-second test
Put a note on the canvas beside the frame called What each element answers. One row per element on the dashboard, with four parts: the element, the question it answers, the action it supports, and where its data comes from.
- Header timestamp: is this data current? Trust or refresh the page. From the time of the last data sync.
Needs attentionlist: what needs attention? Act on each item before 09:00. From the rota, interpreter bookings and the text message delivery report.52 of 64and12 free: how full is today? Decide whether to take walk-ins. From today's bookings and the rota.- Five service bars: how full is today, by service? Tell the front desk which services have room. Same source.
Not confirmedlist: who has not confirmed? Call each patient before 10:00. From reminder replies.
Any element on the frame that has no row in this note is decoration. Remove it, or write the question and action it serves.
Then test the screen the way it will be used. Show the frame to someone who has not seen it, for five seconds, and hide it. Ask the three questions. Do this with two or three people, ideally including someone from the front desk. If anyone cannot say roughly how full the day is, or that something needs attention, the hierarchy is wrong; make the weak block more prominent and try again with someone new.
Check it worked
Your mapping note has one row for every element in the frame, and every row names one of the three questions and an action. After five seconds, at least two of your testers can say there are three things needing attention, that the day is mostly full with about 12 slots free, and that some patients still need a call.
Next steps
You have a dashboard that answers three questions and a written record of what you left off and why. The same discipline carries into other screens:
- /tutorials/design-a-data-table-people-can-scan designs the full appointment table the front desk opens when they need every row, not a summary.
- /tutorials/choose-between-cards-lists-and-tables goes further into when a list beats cards or a table.
- /tutorials/create-visual-hierarchy-with-size-weight-and-position helps when the five-second test shows the wrong block winning.
- /tutorials/never-rely-on-colour-alone-to-carry-meaning covers the greyscale check in more depth.
Part of these paths
Related tutorials
- Design a data table people can scanYou will have a desktop appointment table for Larkfield Clinic's reception staff, with columns ordered by task, aligned numbers, two row densities, sortable headers, row actions and a selected state, plus a written spec for every column.
- Choose between cards, lists and tablesYou will have the same five clinic services laid out as cards, a list and a table, scored against four questions, with one layout chosen for patients, one for staff and a short written rule for when each container wins.
- Create visual hierarchy with size, weight and positionYou will have a strip of six Figma frames that takes a flat confirmation screen to a clear one, one lever at a time, and a squint test showing the primary action is the strongest shape on the screen.
Need this done for you?
Padding does this work for growing companies, from the first diagnosis to a system that keeps working.
Get new tutorials